Use these pre-formatted charts for collecting data, making up surveys and lists, tracking experiment results, and more.

How Do Charts Help Us Explain Things? It is no doubt that visual representation has a profound effect on the way we learn things. It helps us to get a deeper understanding of the things and comprehend the data quickly. When you take a look at the things that are complex, the easiest way to represent them is via graphs and charts. When you use charts in your presentations, it gives your work clarity, authority, and conciseness. Since the main function of charts is to tell a complex story in a simpler way, you can use them to display data and encourage further exploration of complex methods. You can use them when they don't serve adequate in situations when you have larger data and important information to demonstrate the relationships or patterns to deal with. The easiest way to use charts is to think about the information you have on hand and the outcome you want that information to yield. Analyzing the two, you can make charts and support your data.

Sometimes you can't begin to get a handle on your data until you've found the best way to organize it. Whether you are comparing and contrasting the features of different products you want to purchase, collecting opinions for a survey, trying every combination of variables in an experiment, creating a schedule for a conference, planning a presentation, or just making a grocery list, you will need different chart formats. Choose from the handy templates below. Don't be afraid to mix and match the charts from the selections below to create perfectly organized data decks for your projects.


Get Free Worksheets In Your Inbox!


Printable Data Charts

Click the buttons to print each organizer.

Symmetrical Data

A basic list format with space for subject headers. Good for agendas, listing pros and cons, etc.

Print Now!

2x2

Four seasons, four cardinal directions, four food groups…use your imagination! Good for listing characteristics of each.

Print Now!

2x3

Six blank spaces for multiple subjects, or a division of data about a single subject.


2x3 Topics

Three subjects or prompts go in the left column, with space to the right for data.

2x4

Eight blank spaces for multiple subjects, or a division of data about a single subject.

2x4 Topics

Four subjects or prompts go in the left column, with space to the right for data.

2x5

Ten blank spaces for multiple subjects, or a division of data about a single subject.

2x5 Topics

Five subjects or prompts go in the left column, with space to the right for data.

2x6 Chart

Twelve blank spaces for multiple subjects, or a division of data about a single subject.

2x6 Topics

Six subjects or prompts go in the left column, with space to the right for data.

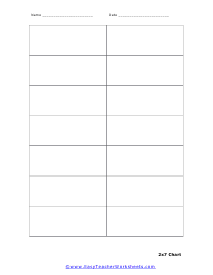
2x7 Chart

Fourteen blank spaces for multiple subjects, or a division of data about a single subject.

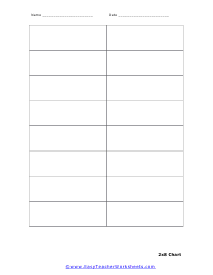
2x8 Display

Sixteen blank spaces for multiple subjects, or a division of data about a single subject.

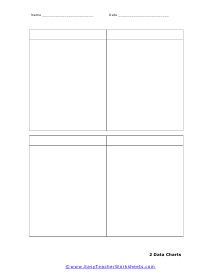
Double Data Set Series

Four separate spaces with a dedicated header row on each. Good for tracking simple variables.

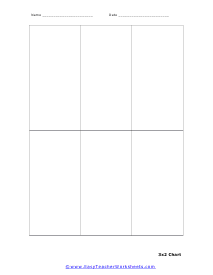
3x2

Six tall, rectangular spaces are perfect for creating multiple lists, such as agendas or performance records.

3x3 Chart

Nine spaces for listing multiple subjects, organizing agendas, or tracking more complicated variables.

3x4

Twelve spaces for listing multiple subjects, organizing agendas, or tracking more complicated variables.

3x5 Chart

Fifteen spaces for listing multiple subjects, organizing agendas, or tracking more complicated variables.

3x6

Eighteen spaces for listing multiple subjects, organizing agendas, or tracking more complicated variables.

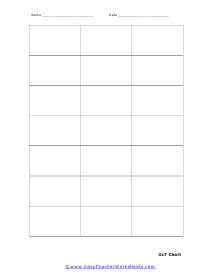
3x7 Chart

Twenty-one spaces for listing multiple subjects, organizing agendas, or tracking more complicated variables.

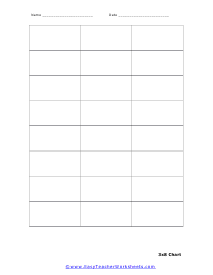
3x8

Twenty-four spaces for listing multiple subjects, organizing agendas, or tracking more complicated variables.

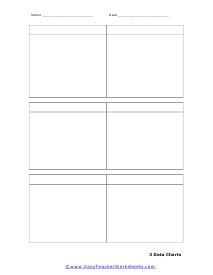
3 Data Charts Series

Six blank spaces with a dedicated header row on each. Good for tracking simple variables.

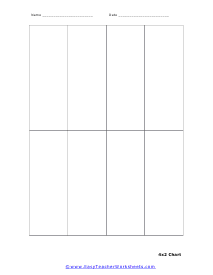
4x2

Eight tall, rectangular spaces are perfect for creating multiple lists, such as agendas or performance records.

4x3 Chart

Twelve tall, rectangular spaces are perfect for creating multiple lists, such as agendas or performance records.

4x4

Sixteen spaces for listing multiple subjects, organizing agendas, or tracking more complicated variables.

4x5 Chart

Twenty spaces for listing multiple subjects, organizing agendas, or tracking more complicated variables.

4x6

Twenty-four spaces for listing multiple subjects, organizing agendas, or tracking more complicated variables.

4x7 Chart

Twenty-eight spaces for listing multiple subjects, organizing agendas, or tracking more complicated variables.

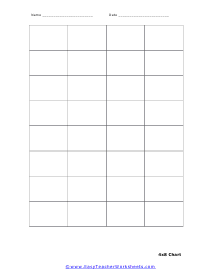
4x8

Great for daily start up routines for students.
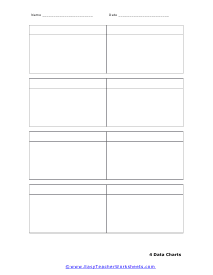
4 Data Charts

Eight separate spaces with a dedicated header row on each. Good for tracking multiple variables.
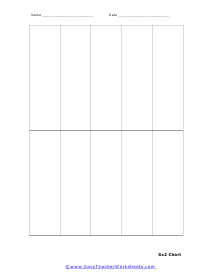
5x2 Chart

Ten tall, rectangular spaces are perfect for creating multiple lists, such as agendas or performance records.
5x3 Chart

Fifteen tall, rectangular spaces are perfect for creating multiple lists, such as agendas or performance records.

5x4 Chart

Twenty spaces for listing multiple subjects, organizing agendas, or tracking more complicated variables.

5x5 Chart

Twenty-five spaces for listing multiple subjects, organizing agendas, or tracking more complicated variables.

5x6 Chart

Thirty spaces for listing multiple subjects, organizing agendas, or tracking more complicated variables.

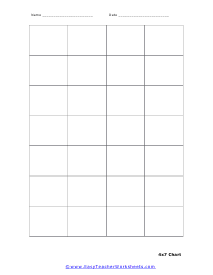
5x7 Chart

Thirty-five spaces for listing multiple subjects, organizing agendas, or tracking more complicated variables.

5x8 Chart

Forty spaces for listing multiple subjects, organizing agendas, or tracking more complicated variables.

6x6 Chart

Thirty-six spaces for listing multiple subjects, organizing agendas, or tracking more complicated variables.

7x7 Chart

Forty-nine spaces for listing multiple subjects, organizing agendas, or tracking more complicated variables.

8x8 Chart

Sixty-four spaces for listing multiple subjects, organizing agendas, or tracking very complicated variables.

9x9 Chart

Eighty-one spaces for listing multiple subjects, organizing agendas, or tracking very complicated variables.

10x10 Chart

One hundred spaces for listing multiple subjects, organizing agendas, or tracking very complicated variables.

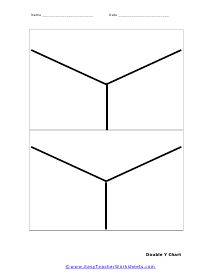
Double Y Chart

Y charts are perfect for separating similar characteristics about a single subject into their own groups.

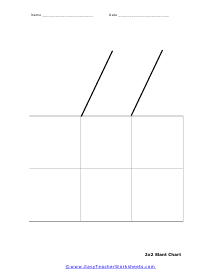
2x2 Slant Chart

Slant charts are the best choice for tracking repetitive events, or interactions among variables.

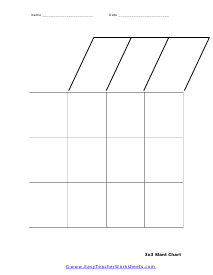
3x3 Slant Chart

Slant charts are the best choice for tracking repetitive events, or interactions among variables.

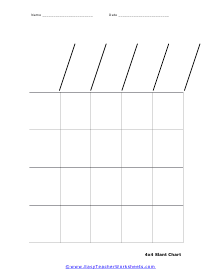
4x4 Slant Chart

Slant charts are the best choice for tracking repetitive events, or interactions among variables.

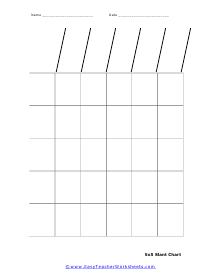
5x5 Slant Chart

Slant charts are the best choice for tracking repetitive events, or interactions among variables.

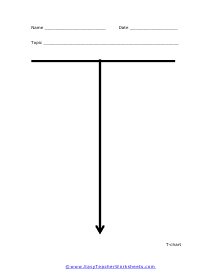
T-chart

Use a T-chart for brainstorming, listing pros and cons, tracking data from two different groups, and more.

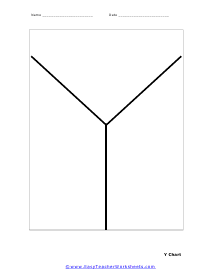
Y Chart

Y charts are perfect for separating similar characteristics about a single subject into their own groups.