Printable Fishbone Graphic Organizers
Click the buttons to print each organizer.

2 Levels - 6 Ribs Fishbone Map
This diagram offers the traditional six "bones" with space for one or two expansions.

3 Levels - 6 Ribs Fishbone Map
Start off with three main concepts and then build off of them in 2 different directions each.

4 Levels - 6 Ribs Fishbone Map
This is helpful to really lock down evidence towards one of your main points..

2 Levels - 8 Ribs Fishbone Map
A good diagram for the Marketing industry. It can be used to flesh out basic points, if you are looking to really add a great deal of evidence move on to the next graphic organizer.

3 Levels - 8 Ribs Fishbone Map
When you have two thoughts that are leading in different directions, this is very solid.

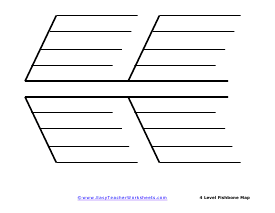
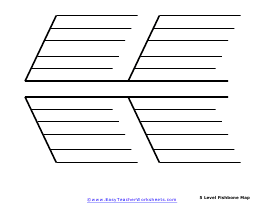
4 Levels - 8 Ribs Fishbone Map
This diagram has eight "bones" with space for three or four expansions.

1 Level Colored Fishbone Diagram
This diagram is used when you are first introducing or reviewing something that does not have many properties associated with it.


3 Level Fishbone Diagram
I would use this fishbone when you have a healthy amount of evidence to prove you point.
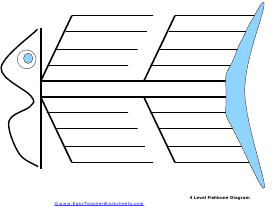
4 Level Fishbone Diagram
This diagram is a favorite of Social Studies Teachers. We get at least 2 thank you notes every week.

5 Level Fishbone Diagram
This orgainzer is used when you have more evidence than concepts to support with them.
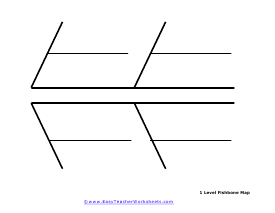
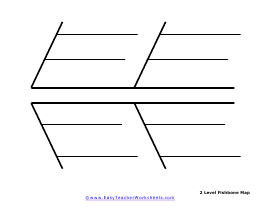
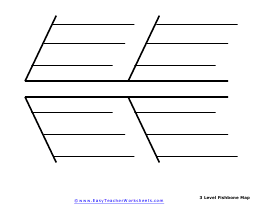
3 Level Fishstick Map
We love this one, it is one of our most popular orgainzers on the site of all time.
5 Level Fishstick Map
Teachers use this Fishstick to hammer home points that have a great deal of evidence.
Vertical Fishbone Map
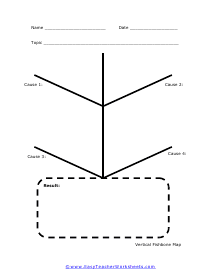
A beginning fishbone diagram, with space for four possible causes to one effect, arranged vertically.
What are Fishbone Graphic Organizers?
Fishbone organizers are a visualization tool used to identify the root causes of a problem. A typical version of this graphic organizer combines brainstorming and a mind map template. It is named such because the diagram's design looks exactly like a fish skeleton.
Primarily used for troubleshooting and product development, fishbone graphics act as a conversation enabler for a problem. When people have brainstormed the possible causes of a problem, the group leader uses a fishbone diagram to rate those potential causes according to their importance level.
Fishbone diagrams are filled in starting from right to left, and each large "bone" branches out to several smaller bones to include more detail.
Dr. Kaoru Ishikawa came up with the concept and drawing of a fishbone organizer to assist quality control engineers in analyzing major issues and finding appropriate solutions. These are also called cause-and-effect diagrams or Ishikawa diagrams.
How is a Fishbone Diagram Created?
During a brainstorming session or a team meeting, these are often drawn on a whiteboard following these steps:
1. A box is drawn in the head of the fish, and the problems are listed inside it. An arrow drawn across the page, pointing towards the head, acts as the backbone.
2. At least four arches are drawn, branching outwards from the spine, making the bones of the fish and representing potential causes.
3. These causes require team members to brainstorm to identify any contributing factors for the corresponding cause.
4. Each cause's breaking down continues until the root cause has been identified. The group then decides on a viable solution and discusses the next steps.
Advantages of Using Fishbone Organizers
1. It is a straightforward way to involve all team members simultaneously.
2. They help uncover the root causes and keep the discussion focused on the issues at hand.
3. It enhances systematic thinking, encouraging the team members to think outside the box.
4. It furthers analytical abilities and promotes the skills of undertaking corrective actions.
5. It helps identify the cause-and-effect relationships of the issues at hand.
Disadvantages of Using Fishbone Organizers
1. In the brainstorming session, many irrelevant causes may be discussed along with one or two relevant ones, prolonging the discussion and wasting precious time.
2. Sometimes, adding multiple factors to the organizer may result in a chaotic diagram that is difficult to display and understand.
3. A fishbone organizer may have a low success rate due to identifying and resolving multiple potential causes.
When to Use Fishbone Organizers?
Here are a few reasons why people may find the use of these helpful:
1. For the identification of the possible causes of a problem.
2. For developing products that address issues with the availability of current market offerings.
3. For revealing bottlenecks and weak areas in a business process.
4. To avoid employee burnout and recurring issues.
5. To ensure resolution of issues through the discussed and decided corrective actions.
Helpful Tips for Creating a Fishbone Diagram
1. Select a team by adding members from all departments directly or indirectly involved in the issue resolution process.
2. Highlight the significant causes from the start and keep adding more while brainstorming. Keep the information organized and don't stray away from the primary purpose.
3. Analyze the fishbone diagram and ask "why?" questions to quickly get to the root cause.
4. Consider swapping the diagram with a root cause analysis tool if the diagram becomes too confusing due to clutter.
5. Adopt a voting technique for root cause identification by making each team member vote for their idea of a root cause.

