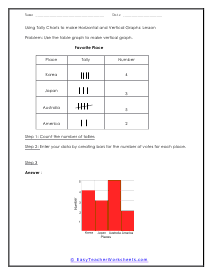
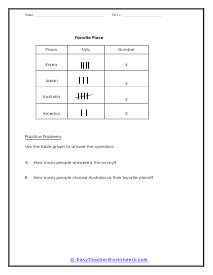
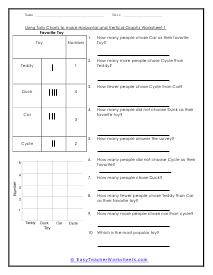
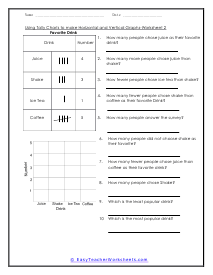
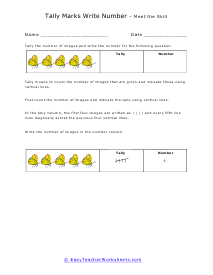
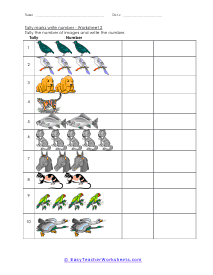
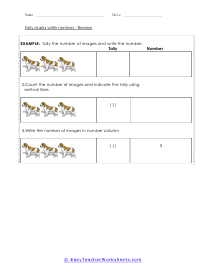
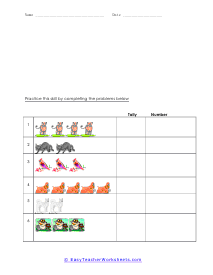
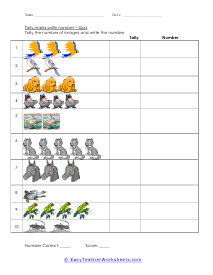
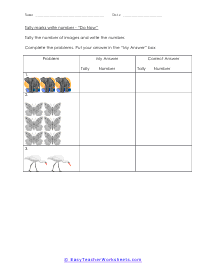
What Are Tally Charts? Counting can be tricky, for sure. Have you ever wondered how people who lived in the earlier civilizations would count? The most obvious, and the first-ever method for counting, was through hands. Counting on fingers eventually developed as a method of communication. With time, methods for counting started evolving. Between 40,000 to 25, 000 years ago, European and African cultures started marking lines on notched bones called Ishango Bones. These lines were the initiation of tally marks, which are now used in tally charts. Notches were carved into the bones for denoting numbers with tally marks. This can be considered as the first tally chart for showing data collection and its representation. So when we see packets of four cut by a fifth line, the symbol is known as a tally mark. These tally marks represent valuable data. Tally charts are used throughout the world for a visual representation of the data. They are easier to understand and count numbers easily. A tally is a way of making a mark that signifies a piece of data. For example we could mark a single tally for every time a player scored a goal in soccer.
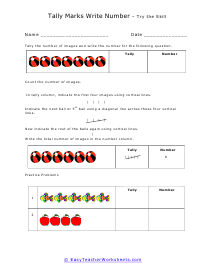
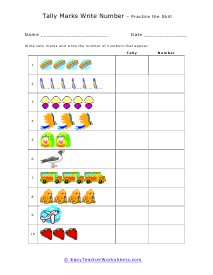
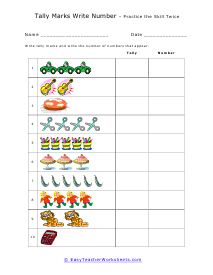
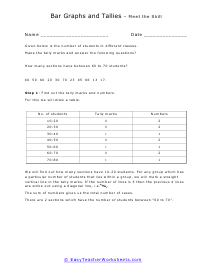
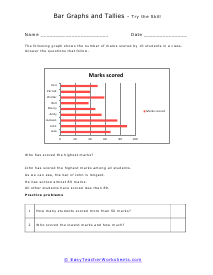
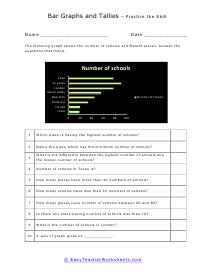
Tallies can also as a collective to mark chunks of larger data. For example if we were looking at how many points a basketball player scored, we could have each tally represent two or more points each. Tallies are used throughout the world to record measurable observable occurrences. Tallies are often arranged it to clear to read charts. These worksheets explain how to use tallies and convert tallies to numbers and to bar graphs. They will also learn how to use tallies in order to sort simple data sets, and convert the tally marks into related bar graphs.