One of the best ways to help your child learn math is through graphic organizers. Graphic organizers are quite useful tools since they help children in solving problems by breaking them down into simpler steps. They are wonderful and can help children in learning which operation to use in the question and when. Through these graphic organizers, kids can also get ahold of new concepts in the subject. Graphic organizers are of various types and work for children of all ages. Depending on your child's needs and age, you can easily adjust the level, problems, and topics. Math graphic organizers will help you piece together problems and break them down piece by piece. Students of all ages will be able to find sheets that help them brush up on general math skills, whether basic math or pre-algebra and geometry.
Printable Graphic Organizers For Math
Click the buttons to print each organizer.
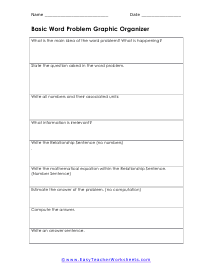
Basic Word Problem Graphic Organizer
This worksheet gives students the steps to follow in order to convert a word problem into a mathematical equation.
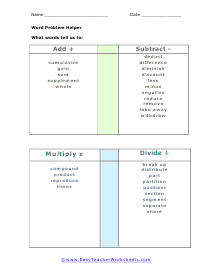
Word Problem Action Words
This worksheet provides context clues to word problems by listing synonyms for basic math functions.
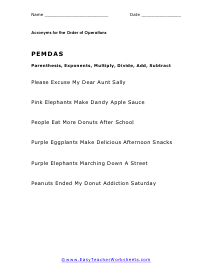
Acronyms for the Order of Operations
This worksheet provides several acronyms to help students remember the proper order of operations.
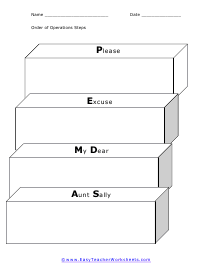
Order of Operations Steps
This worksheet provides visual blocks in which students can carry out each part of solving an equation according to the order of operations.
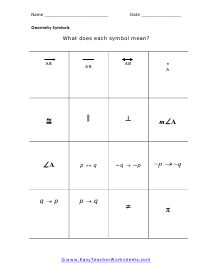
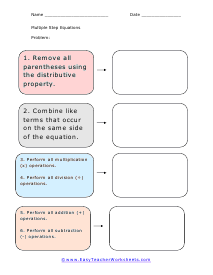
Workflow For Multiple Step Equations
This worksheet walks students through solving complicated equations by identifying each stage of the order of operations.
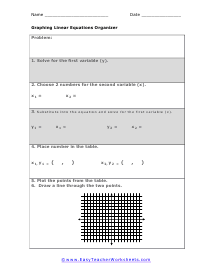
Graphing Linear Equations Organizer
This worksheet provides the steps to solve and graph linear equations.
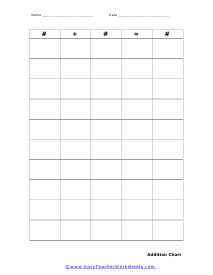
Addition Workflow Chart
These can be used to used to write addition equations by completing the chart with the prompted symbols.
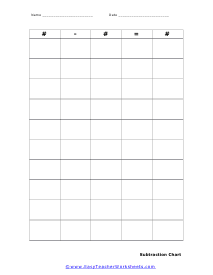
Subtraction Process Chart
Students will build subtraction equations by filling in the blanks with the prompted symbols.
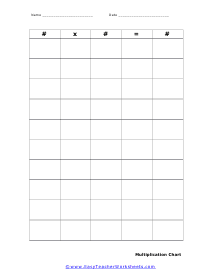
Multiplication Work Chart
This is a great way to setup up and solve a product in a different way of looking at these types of problems.
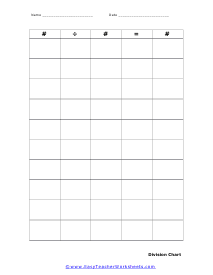
Division Operation Chart
This is a great way to solve and organize any quotient type of problem you may come across.
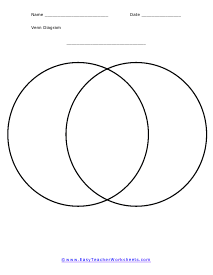
Math Venn Diagram
A Venn diagram is something that is used to describe relationships or groups of things. This can be used in math to show a similarity or difference between anything.
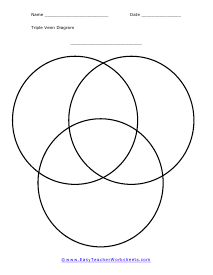
Math Triple Venn Diagram
Students can sort numbers by three designated factors to fill out the Venn diagram.
Ones, Tens, Hundreds Places Tag
This can help students learn to place the digits of a number in a vertical format which break up things into a different orientation than they are accustomed to.
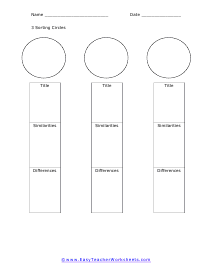
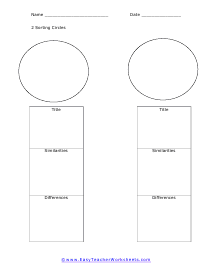
3 Sorting Circles
Students will use the chart to compare and contrast items using their characteristics.
2 Path Sorting Circles
This is an alternative to using a Venn diagram. It allows you to drop in more detail about the nature of the subject that you are exploring.
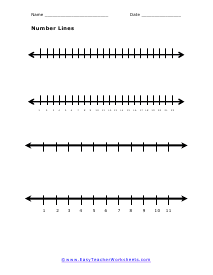
Workable Number Lines
Blank and labeled number lines to practice skip counting, basic addition and subtraction, and more.
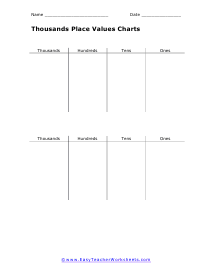
Thousands Place Values Charts
Students will list numbers and identify the ones, tens, hundreds, and thousands places in each.
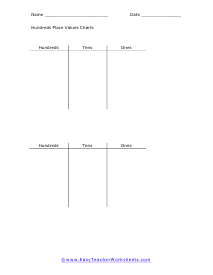
Hundreds Place Values Charts
This allows you to break apart a value into one to three place values. It makes for a nice visual that will work for most people.
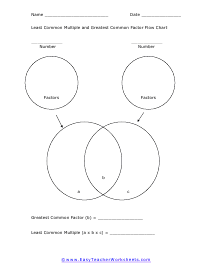
Least Common Multiple and Greatest Common Factor Flow Chart
Students will identify number factors and use the chart to identify LCM and GCF.
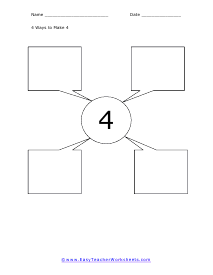
4 Ways to Make 4
In this worksheet, students will identify four ways to get four with simple addition.
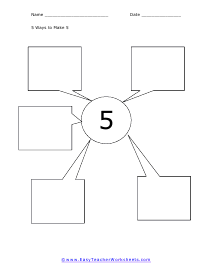
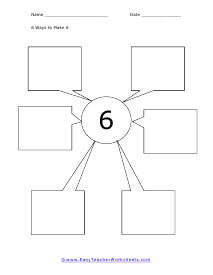
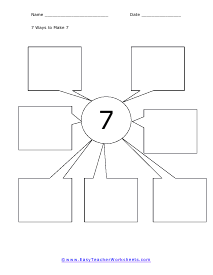
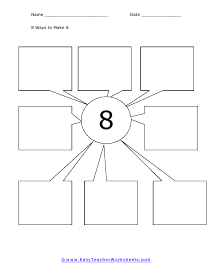
8 Ways to Make 8
Using simple addition or subtraction, come up with eight different equations that total eight.
Subtraction Chart
Students will build difference equations by filling in the blanks with the prompted symbols.
Multiplication Chart
When you are determining the outcome of a product of numbers, this can be super helpful.
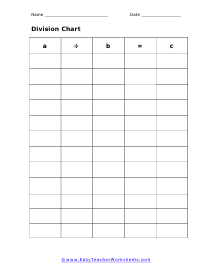
Division Chart
This organizer will help you become better at aligning your equations. Students find that when begin to set things up this way, their mental math skills improve a great deal.
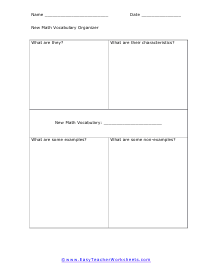
New Math Vocabulary Organizer
A worksheet for students to use when learning new math symbols, concepts, or equations.
How are Graphic Organizers Used in Math?
Math is one of the most troubling and confusing subjects for sure. There are many questions that make children nervous, and often they are so lost; they don't know what to do. However, there are many ways to make the subject interesting and less difficult for your child. Oh, the equations can be complex, but the subject is very straightforward. Everything builds on what came before it. When you learn to add, you learn to subtract. If you can multiply, you can divide. A handful of basic rules will take care of the vast majority of your everyday math needs, and the biggest challenge is learning how to frame the problems so you know which formulas to apply. These worksheets will keep the process sharp.<br>
Math can be tough for some people, but it doesn't have to be! One of the most effective ways to make it easier to learn math concepts and solve problems is through the use of graphic organizers-visual representations of the relationship between different variables or different parts of a problem that you can use to better understand how to solve the math problem itself.
In this guide, we'll go over how to use graphic organizers in math, including when they are most helpful and how to choose the right organizer for your problem.
What Is a Graphic Organizer?
A graphic organizer is any visual representation of information that helps individuals understand and process information. Graphic organizers can be divided into two categories, those used as pre-study tools and those used while studying.
Pre-study graphic organizers are often called mind maps and serve as a form of brainstorming by organizing and arranging ideas in a way that makes them easily accessible and presentable.
Study graphic organizers, such as concept maps, flow charts, webs, timeline charts and Venn diagrams, are typically used during or after a learning activity when one might need to clarify concepts or study for an exam. They can help students sort out complicated information by forcing them to make connections among multiple pieces of information.
How Are They Helpful In Math?
Graphic organizers are commonly used in the math classroom to help students represent and understand information that they're working with, and to guide them through the process of solving mathematical problems.
A great deal of math instruction is communicated visually, in charts and graphs and diagrams. For kids, who are visual learners by nature, that makes a lot of sense. However, it's not just children who benefit from images and symbols; they're incredibly useful for adults too. Studies have shown that not only do our brains process graphic information faster than written text but we also tend to remember images more clearly. Our ability to map things out using pictures actually increases how well we understand complicated concepts like math - particularly if those pictures come with explanations or additional information on them.
Example #1 - Classifying Objects
In math, when you're trying to organize objects into a set, it's helpful to picture what they look like or can be compared with. An example of an object that may need classification is animals. Some examples of animals are frogs, dogs and cats. These can easily be organized on a Venn diagram because frogs share many qualities with amphibians, dogs have similar qualities as mammals and cats share some characteristics with feline pets.
To classify objects in math, think about how they could be organized into categories or groups.
Example #2 - Identifying Patterns
Multiple-choice tests rely on your ability to read graphs, tables and figures. Without a strong grasp of graphic organizers, you're more likely to miss key details or make careless mistakes. Graphic organizers help you find patterns and generalize information that may be tricky for your brain to absorb in other formats.
For example, if you're learning about percentages – an essential part of math – it helps to see them visually represented. By working out how each piece contributes to 100%, you can apply that knowledge to real-life situations such as restaurant bills and sales discounts.
Example #3 - Problem Solving
Graphic organizers are an effective way to teach students how to figure out math problems without even realizing they are learning math.
For example, if you see a question like Jack gave Tina eight flowers. How many flowers did she give him? A spatial visualization will help you process what it means for Jack and Tina to each give one another even amounts of flowers. While visualizing math problems might feel awkward at first, stick with it; it could really pay off in the long run!
Ending Note
An organized, visual approach is often a student's best tool for tackling math problems. Whether used in conjunction with other study strategies or on their own, graphic organizers give students an efficient method of tackling complex math problems.

