
Printable Relationship Circular Chains
Click the buttons to print each organizer.
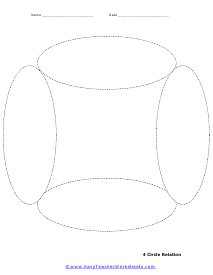
Surrounding Relations
A good sheet to use when building arguments with multiple supporting premises. The basic thought is focused in the center.
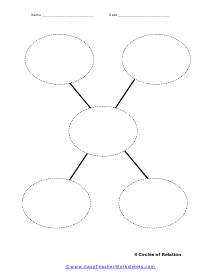
4 Circles of Relation To Theme
Display a root cause or central character, and fill in the outer four bubbles with effects or relationships.
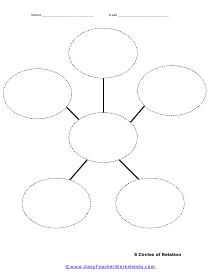
5 Circles of Relation
This sheet has five outer circles for larger projects or more complicated data sets.
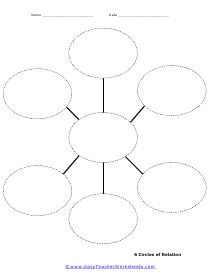
6 Circles of Relation
Six circles surround a central core idea, cause, or character. Chart the relationships among many variables.
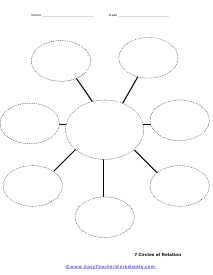
7 Circles of Relation
This sheet has seven circles around a central space to note relationships in bigger sets of data.
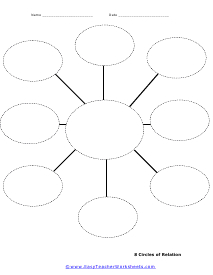
8 Circles of Relation
Use the eight circles surrounding the center space to keep track of multiple variables, effects, or characteristics.
What is a Circular Relationship?
If you ever need to present a relationship within a specific component, you may need to define a circular relationship between the component and its inner parts. Such relationships are often showcased using circular diagrams. Most common in workplaces, circular diagrams highlight the relationship between two entities, departments, items, or attributes. Whether you need to present an intradepartmental hierarchy or a specific category of employees within a single department, using circular diagrams may help you.
You can define multiple sections within a circular chart depending on the complexity of your subject. While this may be correct, concentric circles are best to portray data using circular diagrams. You may also arrange separate colored circles to present the information on some occasions. Let's look at the details of both to understand their application.
Ways to Define Circular Relationship
Using Concentric Circles
Concentric circles can define less detailed data by arranging it within a central circular diagram. You do not have to draw circles outside the main figure to identify information. This model is suitable for defining the circular relationship between correlated entities from a top view angle. You may apply it in simple-to-describe cases where less information can describe more.
For example, if you want to present the number of minorities in a state, you may use the central circle to identify the state's name. By drawing a smaller circle within the main circle, you can represent the presence of minorities in the region. Similarly, to highlight the total population of two different cities in the same country, you can form two smaller circles (based on the entire city population) within a large circle (country).
Concentric circles are ideal for describing the primary classification of two or more interrelated entities.
Using Independent Circles
Independent circles are suitable to use when you need to represent complex information. Such data may have more descriptive information unsuitable for the concentric format. You may also apply this layout to equally emphasize each (circle's) data. Unlike concentric circles, independent loops provide an in-depth look at the information described.
For example, you can represent different cities of the same country by highlighting each city's specialties. Independent circles are also helpful in describing the causes of a specific effect. Suppose you want to represent the causes of a heart attack. You may add high cholesterol levels, obesity, irregular blood pressure, etc., with one-liners of each in the independent circular diagrams.
Independent circles are most suitable for describing a correlated component's more profound knowledge.
How to Create Circular Relationship Diagrams
If you want to create flawless circular relationship diagrams, you can find online tools to develop circular charts. You may need to choose a suitable (concentric or independent) template to start. Online tools provide the ease of making quick changes to the data. By adding and organizing information in the chart, you can describe simple or complex relationships between entities.
Before you begin the process, you may need to arrange and simplify your data. The amount of information you add to your presentation may affect the size of the circles. To avoid any changes in the later stage, you can create a rough draft to define your data's hierarchy (if required) and terminologies.
Online graph creation tools may or may not ask you to pay for the service. You can check it before spending time developing your circular diagram. While most users may opt for free tools, paid ones can offer you enhanced functionality. Free tools may work well if you do it for a personal project. However, you may need paid service for business presentations to avoid brand watermarks on your slides.