These worksheets present the concept of graphing in a science-based setting. At first, we will begin to use graphs to sum up our observations and then we will move on the making educated well devised guesses based on the data that we have released on graphs. Each activity will consist of several worksheets and an answer key that may span two or three worksheets, at times. We also have training exercises for students that may have trouble understanding fundamental graphs and their use within these environments. Once students get some time and repetition with these science graphing worksheets they will find what procedure they should use for interpretation. The worksheets start out simple in the frame of understanding basic data collection processes. We then move on to using all forms of graphs and charts that are commonly used in scientific analysis.
Print Science Graphing Worksheets
Click the buttons to print each worksheet and associated answer key.
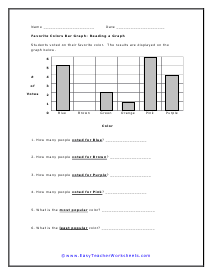
Colors Bar Graph- Reading
You will explore student color perference. The results are displayed on the graph below.
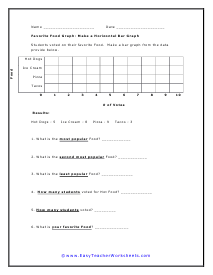
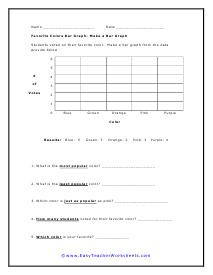
Food Graph- Make a Horizontal Bar
You will examine the types of food that student enjoy. Make a bar display from the data provide below.
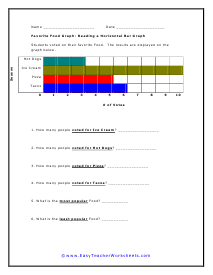
Food Graph- Reading a Horizontal Bars
We get more into food, what is not to love? You will interpret a premade series of bars that go right to left.
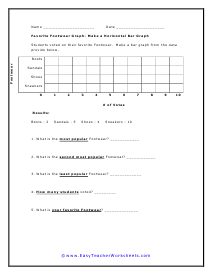
Favorite Footwear- Make a Horizontal Bar Graph
We look at student footwear perferences. Make a bar display from the data provide below.
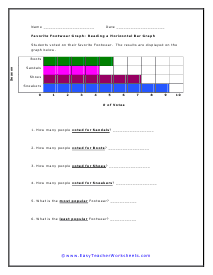
Footwear Graph- Reading
You will determine the most and least favorite type of footwear based on those surveyed.
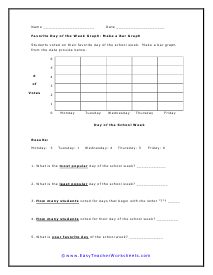
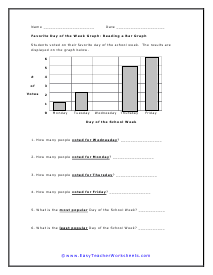
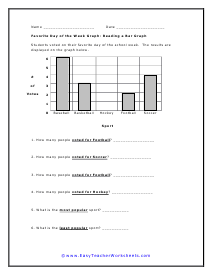
Day of the Week Graph- Reading
What is your Favorite Day of the week? The results are displayed on the graph below and explore it.
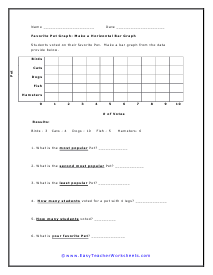
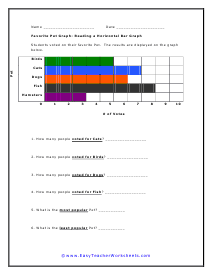
Pet Graph- Reading
Read the graph of your classes favorite pets. Interpret it and answer the questions.
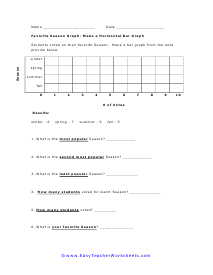
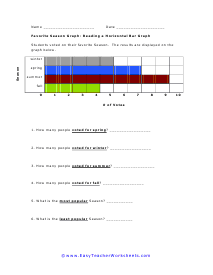
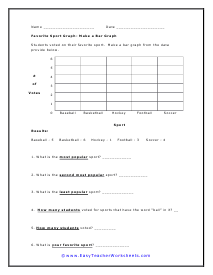

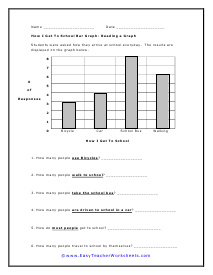
How I Get To School- Make a Bar Graph
How many students use gasoline powered vehicles to get to school?
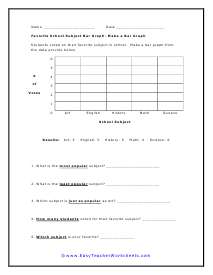
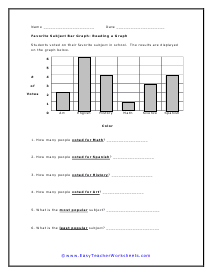
Favorite Subject - Reading a Graph
You will interpret a premade bars and determine who voted for their subject.
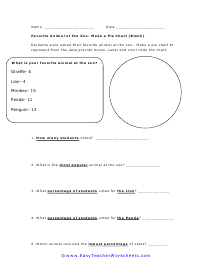
Favorite Animal at the Zoo- Make a Pie Chart (Blank)
Students were asked their favorite animal at the zoo. Make a pie chart to represent from the data provide below. Label and color code the chart.
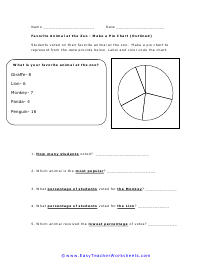
Favorite Animal at the Zoo - Make a Pie Chart (Outlined)
What percentage of students voted for the Monkey?
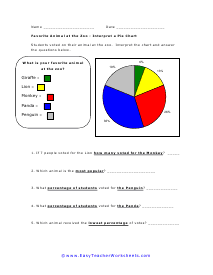
Favorite Animal at the Zoo - Interpret a Pie Chart
Which animal received the lowest percentage of votes?
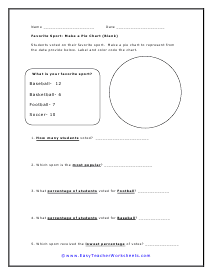
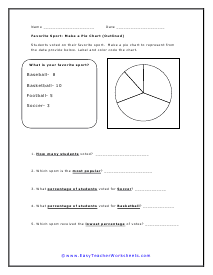
My Favorite Sport Worksheet
I'm a big Ice Hockey fan. On this worksheet the division are already set in place for you.
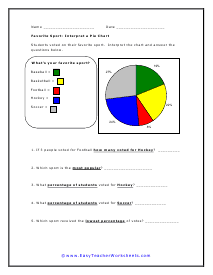
Favorite Sport- Interpret a Pie Chart Worksheet
If 3 people voted for Football how many voted for Hockey?
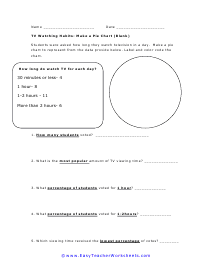
TV Watching Habits- Make a Pie Chart (Blank)
Students were asked how long they watch television in a day. Make a pie chart to represent from the data provide below.
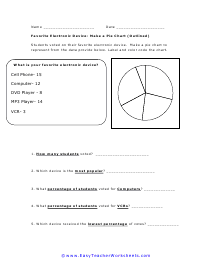
Favorite Electronic Device- Make a Pie Chart (Outlined)
What do you think is the best electronic device out there. Make a pie chart to represent from the data provide below.
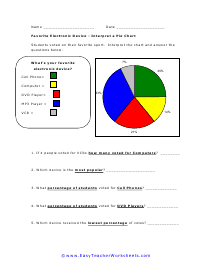
Favorite Electronic Device - Interpret a Pie Chart
You will interpret the meaning of the data found plotted on the pie chart.

Bunnies - Picture Graphing Activity
The Easter Bunny left us a bunch of different eggs! Add up how many of each color egg he left. Create a data table on the bottom of the page.


Making an Easter Egg Observation
Copy your data table from page 1 and paste your eggs from page 2 into the visual display.

Interpreting an Easter Eggs
The graph below shows the colors of the different eggs the Easter bunny left. Answer the questions below.

Peanuts and Elephants - Picture Activity
Elephants love peanuts! Add up how many peanuts the elephant ate for each day. Create a data table on the bottom of the page.


Making a Picture of Peanuts
Copy your data table from page 1 and paste your peanuts from page 2 into the graph.

Interpreting the Peanut Picture
The graph below shows how many peanuts an elephant ate each day. Answer the questions that follow.

How Many Worms - Picture Graphing Activity
Add up how many worms the bird ate for each day. Create a data table on the bottom of the page.

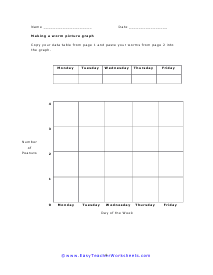
Making a Worm Picture Graph Worksheet
Copy your data table from page 1 and paste your worms from page 2 into the graph.

Interpreting a Worm Pictograph
The display shows how many worms a bird ate each day. Answer the questions below.

What Are Graphs for in Science?
Science uses many different tools to record and present information. Of course, plain text and tables can sometimes appear quite complicated and be challenging to understand. Graphs can feel more intuitive for many people, but what are they sued for in science?
In science we are trying to look for a truth or fact that can be repeated. Graphs and chart are widely used as the standard to take data that has been collected and find trends or relationships between the factors we are studying. In all the cases we present the data has already been collected for you. You are asked to make sense of the data by either creating a graph or analyzing a graph that is given to you. You will be introduced to bar, line, and pie graphs. More importantly, you will be lead to understand the meaning and use of each graph type.
In science, graphs are used to visually present data and information. A person can easily understand the relationship between different values through graphs. Scientists also use graphs to bring the point of an experiment across more quickly.
Here, we'll discuss what graphs are, their use in science, and the common types of graphs you may come across during your studies in science.
Graphs in Science
It can be difficult to understand data when it is presented raw and unprocessed. To help people understand data easier, information is presented visually through graphs.
Graphs can visually present the relationship between two different sets of data. Some information that you can find on a graph can include:
Time (seconds, hours, days, months, years, etc.)
Length (inches, feet, centimeters, meters, etc.)
Temperature (Kelvin, Celsius, and Fahrenheit)
Number of objects/ participants
Graphs commonly use an X and Y axis to represent independent and dependent variables. For example, you might want to analyze how the temperature in a particular area rises and falls throughout different months of the year.
Independent Variables
These variables are usually placed on the X-axis of a graph. They are called "independent" because they are not affected by any other variables in an experiment. These are the variables you manipulate in an experiment.
In some cases, independent variables are known as:
The cause in "cause and effect."
Explanatory variables that can explain a result.
In the previously mentioned example of varying temperatures during the months of a year, your independent variable would be the months of the year—January through December. Your timeline or months would start from the left side of your graph, progressing toward the left side, forming your X-axis.
Dependent Variables
These variables are usually placed on the Y-axis of a graph. They are called "dependent" variables because they change based on how the independent variables are manipulated.
Dependent variables can also be known as:
The effect in "cause and effect."
Response variables that respond to how you make changes to other variables.
Outcome variables, which are the outcome you want to assess or determine.
Again, we use the same example of a year's rising and falling temperatures. Your temperature scale would be your dependent variable. The scale starts from zero and increases as it goes up the graph's Y-axis.
By plotting different points according to the varied temperature each month, you can see how temperatures increase and decrease throughout a year using a graph. It also gives you a more straightforward representation of how monthly temperatures differ.
Common Types of Graphs
Graphs can also present information through different visuals. Some types of graphs are a better fit to analyze specific data.
Line Graph. This type of graph uses the X and Y axis format. It analyzes continuous data taken over a period of time. Each point on the graph is connected so one can understand the change between each connecting point. E.g., how temperature increases and decreases throughout the months of a year.
Bar Graph. This also uses the X and Y axis format. However, this is better used to compare different groups or monitor changes over time. E.g., comparing the amount of fruit different groups of monkeys consume in a day.
Pie Graph/ Chart. Pie charts present percentages or fractions of a whole. E.g., percentages of the different types of gas that comprise our atmosphere.
Conclusion
In science, graphs are used to visually present data and information so that it's easier to understand. Graphs make it easy to interpret the relationship between different variables.


