The slope of any line is a measure of the line's steepness. We can put it simply by saying that it is a ratio of vertical change over time. It gives you an idea of the direction a line is going and can often give you feeling as to where it is headed in the future. In the slope formula this value is represented by the letter m. The worksheets in this section will focus on making you more familiar with the concept of slope and its use in understanding graphed systems. This section provides an introduction to slope. This series of worksheets will work on how to find the slope of lines that pass through given pairs of coordinate points by plugging the coordinates into the slope equation. Two lessons are included here to show how to chart a line on a graph based on its slope and intercepts, and also will show you how to determine the slope of a line based on the intercept points given.
Print Slope of a Line Worksheets
Click the buttons to print each worksheet and associated answer key.

Draw the Line Lesson
Learn how to chart a line on a graph based on its slope and intercepts. Example: A line passes through the point (2, 4). The line has an m value of 3. Draw the line.

Drawing Worksheet 1
For each, draw the line based on the information that is given. Example: A line that passes through the point (2, -2). m = 2

About the Line Worksheet 2
If you know that line passes through point (1, 2) and m = 2, what else do you know about that line? See what you find out based on what we learned so far.

Review Sheet
Follow the steps to review how to draw a line based on the information given: A line passes through the point (3, 5). The line has an m value of 3.

Practice Sheet
For each problem draw the line that is described. It will help to remember that y = mx + b. Example: A line that passes through the point (0, 2). m = 3

Draw a Well Explained Line Quiz
We will spell it out for you now you need to draw it. We describe a point it passes through and the steepness of a line that is either parallel or perpendicular to it.

Do Now
Complete the following problems, then put your answer in the "My Answer" box. Example: A line that passes through the point (1, -2). m = 6

Slope of a Line Lesson
Learn how to determine the steepness of the line that passes through the points given: (2,4), (3,2). That is just one example we will help you understand the position of the rise or fall.

Passing Through Worksheet
You will be given a series of points that a line is positioned to pass through and then you will tell us how it rises or falls.


Review Sheet
Follow along to review the steps for determining the slope of a line based on the intercept points that are given to you.

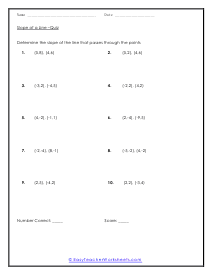
Points Quiz
You will work everything off of the points that you are given. If a line were to pass through all of them, what could you tell us?

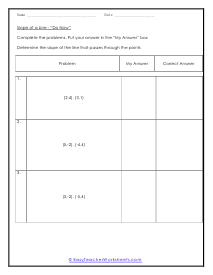
Do Now
Complete the following problems, then put your answer in the "My Answer" box. Example: Determine the slope of the line that passes through the points: (2,4), (3,1)

Meet up with Slope Lesson
Follow the steps to learn how to solve the following problem: Graph a line with an m of 2 which goes through the points (2,5).

Determine Slope Practice Worksheet
You will be given the equation of a line and then you must tell us everything that you can about it.

Solve By Graphing Worksheet
For each problem that you are given you will solve and graph the line based on the information given. This is really helpful to learn where two sets of data overlap.

Algebra Version
You will use your algebra skills to reorder an equation of a line to learn more about it. Example: 1 y = -2x + 7

Slope of Displayed Line
Find the measure of m of the lines shown on this graph, then write the answer in the spaces given below.

Warm Up Line Plots
For these 3 questions follow the steps specified to solve. Example: Plot a line, k, that goes through point (3,1). Is it parallel to line y = -x + 1?


Learning to Draw From Equations
Follow the steps to learn how to draw a line that goes through the given point. You will use a mix of what you have learned and some algebra.

Two Points Worksheet
You will be given 2 points and asked what you could tell about a line that passed through both of them.

Given Points
For each, draw a line that goes through the given point and has the given slope using the graph given. Example: (2, 1) with slope 2

Slope Showoff
Evaluate the following 8 statements using what you've learned about slopes: Example: Determine the value of r so that the line through (-3 , r) and (0, -2) with an m = (-1)/3.

Statement Evaluation Worksheet
Evaluate each of the following statements using what you've learned about slopes. Example: The grade or steepness of a hill is 5%. How many feet does such a road rise in 3 miles?
How to Determine the Slope of a Line
What Is It?
Slope can be defined as the measure of steepness with respect to the direction of the line. Calculating this measure in a coordinate plane is an easy way to determine whether the line is parallel, perpendicular, or none without actually using a compass. Commonly, the slope is calculated by selecting any two distinct points lying on the line and then calculating the ratio of ‘vertical change' to the ‘horizontal change' between them. In other words, the this measure represents the change in the x coordinate with respect to the y coordinate.
I consider this a measure of the impact a line has on a system. To find the value of a slope of a plotted line, just pick two point that it crosses. After notating the two points, subtract the y value of the second point by the y value of the first point. Take that difference and divide it by the measure of the difference between the second point's x value and the first points x value. While many people with just brush over this measure, it is not one to be taken lightly. This is the indicate that something is going very well or very poorly.
Step 1 - Finding the Coordinates of Two Points
As defined earlier, the slope of a line is the ratio of the rise to the run or simply rise divided by the run. The first step to finding this measure is calculating the slope between any two distinct points on the line. To do so, you must know the coordinates of these two points. Suppose the coordinates are as follows
Point 1 = (x<sub>1</sub>, y<sub>1</sub>)
Point 2 = (x2, y2)
Step 2 - Rise Over Run Between Two Points
Since we know that the slope equivalent to the change in the y coordinate with respect to the change in the x coordinate. Hence
Change in y coordinate Δy = y2 - y<sub>1</sub>
Change in x coordinate Δx = x2 - x<sub>1</sub>
We will now use these values in the slope of two points formula, which is as follows
Slope between two points = m
= tan θ
= (y2 - y<sub>1</sub>)/(x2 - x<sub>1</sub>)
Step 3 - Put It Together
To calculate this measure, you must place the values in the following formula
y = mx+b
m is the slope between the two points (tan θ)
θ is the angle the line makes with the positive axis
Δy is the net change in the y-axis
Δx is the net change in the x-axis
Let's use the formula with actual numerical values to further clarify your concept. Consider the following example:
What is the slope of a line that contains points (5, 5) and (4, 2)
According to the above given data:
x<sub>1</sub> = 4
y<sub>1</sub> = 2
and
x<sub>2</sub> = 5
y<sub>2</sub> = 5
Substitute these values in the slope of line formula
m = y<sub>2</sub> – y<sub>1</sub> / x<sub>2</sub> – x<sub>1</sub>
m = 5 – 2 / 5 – 4
m = 3 / 1
m = 3
What Is the Slope For Different Types Of Lines?
Horizontals
A horizontal line is a line directly parallel to the x-axis and is drawn straight from left to right or vice versa. This means that the net change in the y-coordinate of the line is equal to zero.
Therefore, slope of a horizontal line: m = Δy/Δx = zero
Verticals
A vertical line is a line directly parallel to the y-axis and is drawn straight from top to bottom or vice versa. This means that the net change in the x-coordinate of the line is equal to zero.
Therefore, slope of a vertical line: m = Δy/Δx = undefined
Parallels
Two parallel lines always have an equal angle of inclination, meaning θ2 = θ1.
Therefore, the slope of two parallel lines is always equal: m1 = m2
Perpendiculars
Two perpendicular lines always have a right angle (90º) between them. Following the external angle theorem, we understand that θ2 = θ1 + 90º.
Therefore, you can determine there slope as follows
m1 = tan θ1
m2 = tan (θ1 + 90º) = - cot θ1
m1 × m2 = -1


