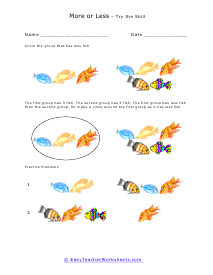
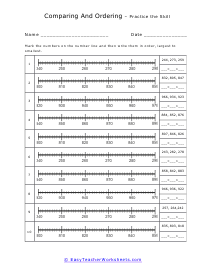
To display our understanding of data we often have to compare the value of integers or data sets. These values can be in fraction, decimal, or percentage form as well. We usually will compare data by saying one side is greater than or less than the other data that is present. One neat little trick that I learned in grade school was that when you are comparing anything with greater than or less than symbols, simply point the arrow towards whatever is smaller. For example if you were compare 23 to 84. 23 is smaller, so using symbols we would point towards 23: (23 < 84). Another trick is what I like to call the crocodile method. I call it the crocodile method because one of the main differences between a crocodile and an alligator is the shape of their snout. Crocodiles have a V-shaped snout while alligators have U-shaped snouts. If we consider the lines of the greater than and less than symbols as a crocodile’s jaws, we just need to remember that the croc. always eats the larger number. For example, if we were to compare the values 7 and 3. The croc. would eat the larger value, in this case 7 > 3. Remember the crocodile always wants the biggest meal possible.
The worksheet topics below are ordered by difficulty. If you are introducing the concept start at the top, as you get more advanced move down the page for the more advanced topics. Below you will find all of our greater than less than worksheets. In most cases, you will be comparing whole numbers or simple integers. We will also have you find which inequalities and expressions are less than or greater than.


