We feature a very large collection of statistics worksheets that highlight many different data analysis techniques.

Statistics is a tool we use to better understand data. We are literally overwhelmed with the amount of statistically information or methods for gathering it we come in contact every day. This includes data from your favorite sports such as batting percentage, goals against average, completion rates, and we could go on for days. This data is tracked to help us make good decisions and predict the outcome of events. Being able to identify what needs to be measured and what it means has made careers for decades. When you are trying to analyze data or looking for a great way to display data to make it more recognizable, we look to statistics. Statistics usually looks to best understand uncertainty and variation. Both which work together, as more variation approached, uncertainty is heighted with it. Probability is a commonly discussed topic in this field. We find probability to change as often as does the parameters or terms it is placed under. To have an educated guess as how to determine all of these values Statisticians must know the as much about the control of the environment is contained.

We feature a wide range of relevant topics that help students learn how to better analyze data and make projections based on their analysis. You will learn the common methods such as central tendency, but we will also show you how to structure that data to help others better understand your work. We have to remember that it is just as important to be able to interpret data as it is to be able to communicate what you see in the data. We feature worksheets that work on simple to complex probability, central tendencies of data, understanding the nature of combinations or reading through regressions and tree diagrams.


Get Free Worksheets In Your Inbox!


Statistics Worksheet Categories

Click any of the images or words below to print out those Statistics sheets.

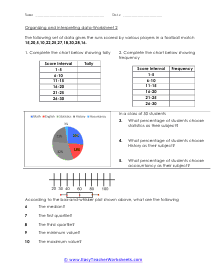
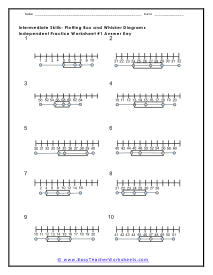
Box and Whisker Plots

This is a method to graphically represent the measures of central tendency and help others see trends or skews in that data.

Print Now!

Calculating Probability as a Decimal, Fraction, and Percentage

Depending on the field that you devote your time to you will need to focus on one standard. So, why not learn all the different numeric represented forms before graduating from school?

Print Now!

Categorizing Data and Bias

Understanding the nature of how your data was collected is just as important as the data itself. This is to maintain a level of credibility which in turn leads to validity.

Print Now!

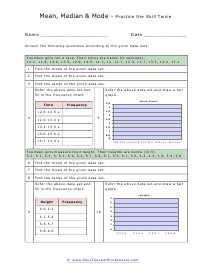
Central Tendency

These common measures (mean, median, and mode) help us find the center point of the data and easily identify outliers.

Print Now!

Combination Probability

This is when you have two events or occurrences happening simultaneously.

Print Now!

Compound Probability

We look at the likelihood of two independent events happening.

Print Now!

Conditional Converse

This is when the position of the hypothesis and conclusion are flipped.

Print Now!

Conditional Probability

This is used to measure the likelihood of dependent events.

Print Now!

Counting Principle

This allows us to measure all the possible outcomes of an event.

Print Now!

Empirical Probability

This is more of a ratio that compares the number of outcomes that an event occurs to the number of trials that were attempted.

Print Now!

Finding the Average (Mean)

We show you a simple formula and how to find the average value for any data set with ease.

Print Now!

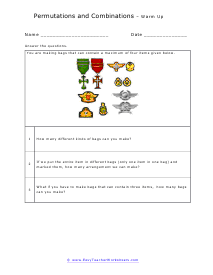
Permutations

When the order of a combination of things as no effect on the outcome at all.

Print Now!

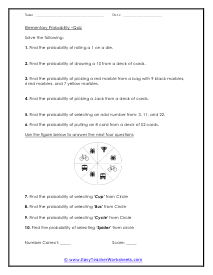
Probability

We learn how to use data and the tools we have available to us to determine how likely something is to happen.

Print Now!

Probability of Mutually Exclusive Events

This just means that the two events have no chance to happen at the same time.

Print Now!

Regression Analysis

This helps us learn to discover what variables actually have a significant and measurable impact.

Print Now!

Relations

Which introduce you to this concept between data sets.

Print Now!

Sample Spaces

Another method we use to determine all the possible outcomes of an event.

Print Now!

Stem and Leaf Plots

This is an effective tool for charting many pieces of data that is collected. You don’t see this used by many people outside of the hardcore math world.

Print Now!

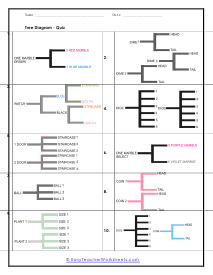
Tree Diagrams

This is a graphical method for charting out possibilities or displaying collected data. It does have a way of keeping you very organized.

Print Now!