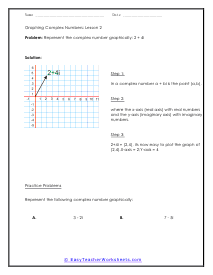
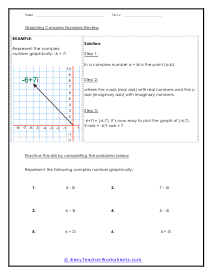
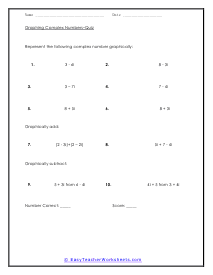
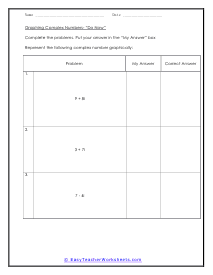
Complex numbers are a mixture of a real number and an imaginary number. All number is just about any number you can think of. When an imaginary number is squared in will result in a negative value. How do you graph complex numbers? There are real numbers, whole numbers, fractions, integers, and then there are complex numbers. Complex numbers are a combination of a real number and an imaginary number. An imaginary number is written with 'iota.' The rule general for them is given by; a ± bi. Here a is the real part and b is the imaginary part. You can graph complex numbers on a graph, what you need to know that these numbers can be plotted on a complex plane and not on a cartesian plane. A complex plane has two axes, the vertical is the imaginary axis and the horizontal one is the real axis.
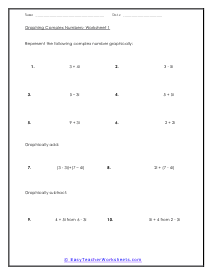
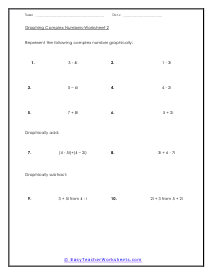
While many students will often think this is never used in real life, electrical engineers rely on complex numbers to understand electromagnetic waves. This collection of worksheets will show you how to represent complex numbers on graph. These worksheets explain how to graph complex numbers. Your students will use these activity sheets to practice converting complex numbers into points on a coordinate grid. In some cases, students will also be required to add and subtract complex numbers.