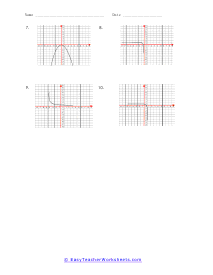
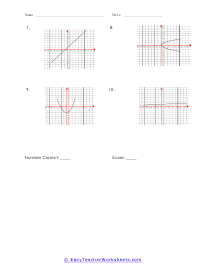
A function is a special type of relationship in math. It is a set of input that results on possible outputs. Functions describe a scenario where what you put in will result in what comes out of it. Functions help us make educated predictions. In many cases you will just chose random values for the inputs, but they will result in a solid graphical function. You will need to be able to recognize, create, and even draw functions on a graph.
How Do You Graph a Function?
Functions are an important part of mathematics and it crucial to have a complete understanding. So, let us start with the basics, what are functions? To simply put it, a function is a way to relate an input and output. You can take a function as a machine in which you have an input and output. The classic way of writing a function is f(x).
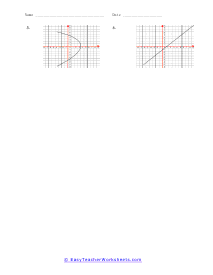
There are different ways of graphing a function.
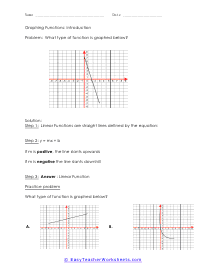
The first method is to assume linear functions as simple, easily graphed lines. Here f(x) can be represented by y. Now you can insert values into x and find out the corresponding values of y. This is the simplest way to graph a function.
You can even graph functions like a linear equation using the slope as the co-efficient of x in a function is the slope of the line. The constant value is the y-intercept.
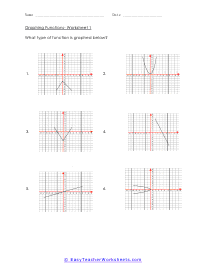
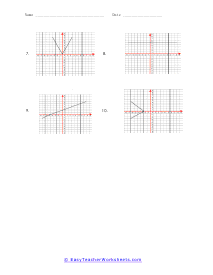
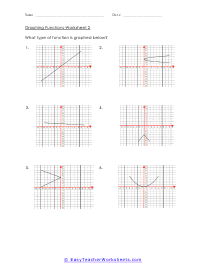
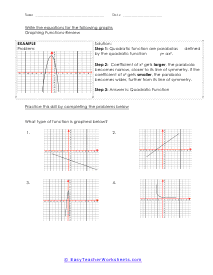
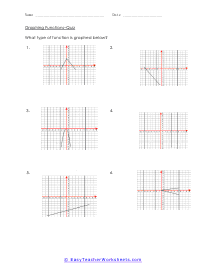
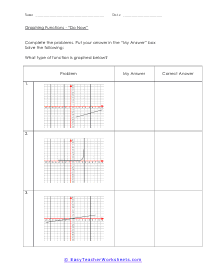
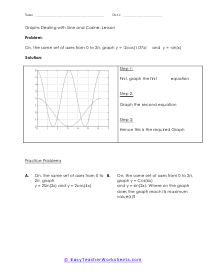
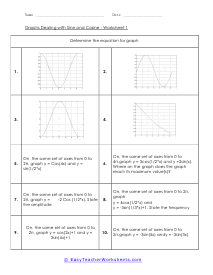
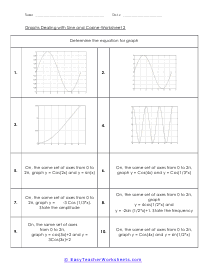
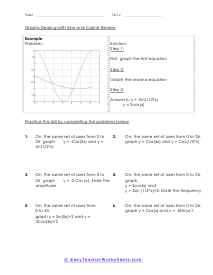
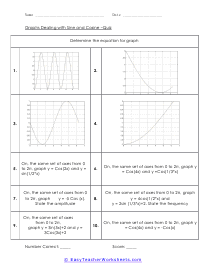
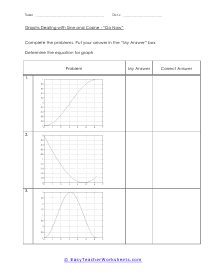
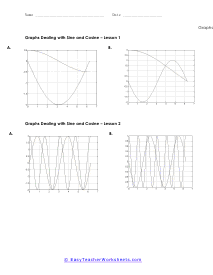
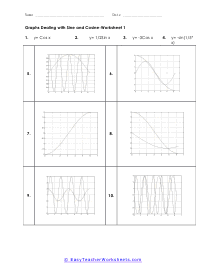
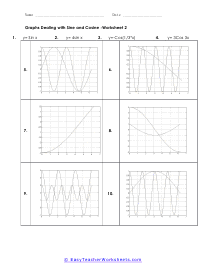
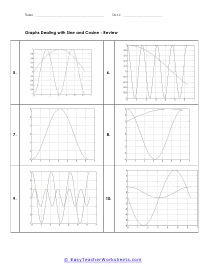
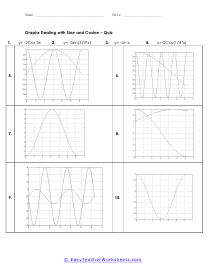
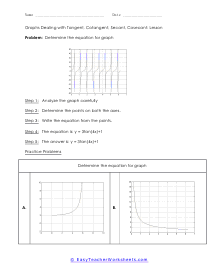
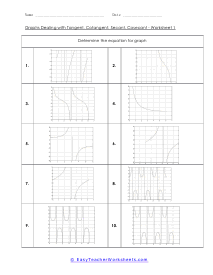
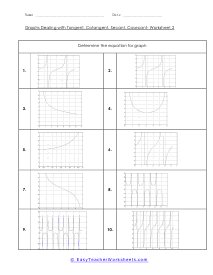
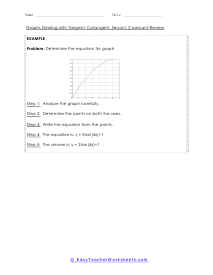
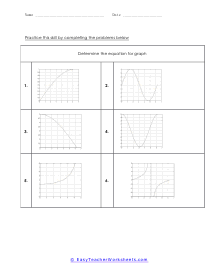
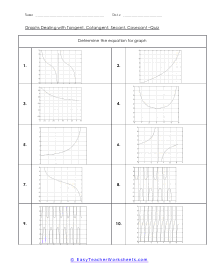
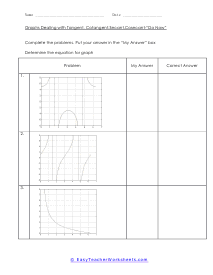
These worksheets explains how to determine the type of function in a graph, and how to find the equation that describes a graph. Students will also learn how to convert given functions into a graphical representation using sine, cosine, tangent, etc.