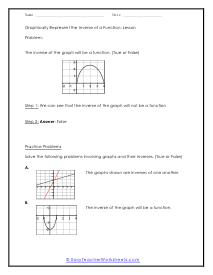
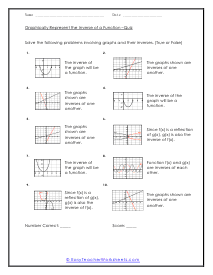
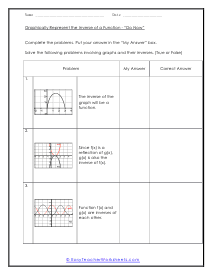
How Do You Represent Inverse of a Functions Graphically? Graphing a function is easy. All you have to do is assume three to five values for x. Substitute the value of x into the function to find out the corresponding values of f(x). Plot the values of x on the horizontal axis and the corresponding values of the function of the vertical axis. But, what if you have to represent the inverse of a function graphically? Well, it is not that difficult either. You need to plot the graph of it and then switch the values of x. Without doing much, you will have the inverse set on your graph. It is that simple!
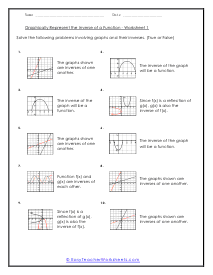
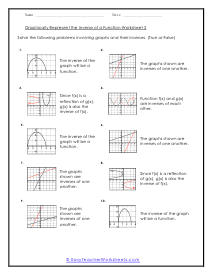
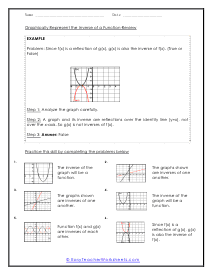
An inverse function basically undoes whatever the original function did. This quarry of worksheets and lessons provides students with premade graphs and asks students to identify functions or their inverse based on this graph. You will be presented with clearly true and false problems here. The function appears as the black line and the inverse as the red line on the graphs. These worksheets explain how to determine if the inverse of a graph will be a function. Students should already know how to convert functions into graphs, and vice versa. Questions are True/False.