These worksheets will teach your students how to compare data sets by using simple histograms.

A histogram is an estimated illustration of the circulation of mathematical or categorical data The purpose of histograms is to review the circulation of a univariate data set graphically. They show the center, meaning the location of the information; spread that is the scale of the data; attendance of multiple modes in the statistics. In a histogram, each bar group numbers into series. The taller bar shows that more data falls in that series or range. They show the spread and the shape of continuous sample data. The main difference is that it is only used to plot the frequency of score incidences in a constant data set that has been divided into categories, called bins. On the other hand, bar charts can be used for a lot of other kinds of variables that include nominal and ordinal data sets.

Students will often confuse histograms with common bar charts. While they look somewhat alike, they serve different purposes. Bar charts are commonly used to compare variables. Histograms on the other hand are used to display distributions of variables. Bars in bar charts can be moved around without any repercussion on the validity of the data. Histograms cannot be reordered. Bar charts have spaces between the bars, histograms do not have spaces between their bars. Your students will use these activity sheets to learn how to group data sets into histograms in order to compare and answer questions. Students should already be familiar with the function of histograms.


Get Free Worksheets In Your Inbox!


Print Histogram Worksheets

Click the buttons to print each worksheet and associated answer key.

Independent Practice 1: Reading and Making Histograms

You are provided with an age and grade based frequency distribution. Answer the questions based on the data.

Independent Practice 2

What is the difference of players playing tennis and basketball based on the data distribution?

Data Practice Sheet

Example questions: How many medals school C won less than school B? What is the highest life expectancy for any country?

Reading Histograms Worksheet

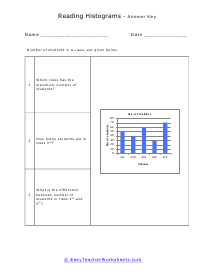
Which subject has lowest number of students passed? How many students passed in biology than have passed math?

Reading and Making Sense

Which Year has highest sale? What is the sale in million dollars for year 2005? How many total accidents occurred in may and june together?

Making Histograms

Histograms are like bar graphs, but the bars are drawn so they touch each other. Histograms are used to help make sense if numerical data. Histograms are used if the data can be separated into distinct groupings or categories.

Making Hockey Tournament Histograms

Mark takes part in a hockey tournament and scores many goals. The tournament consists of 20 matches. The numbers of goals that he scored are shown below. Organize them in order of interval 5 and take the help of given table.

Frequency of Hours of Playing Cricket

A mother asked his child how many hours did he play cricket every day of a month.

Soccer Histogram

The table below shows the no. of goals that a team scored in the National level tournament.

Frequency of Cookies

Dick buys a different number of cookies on 30 occasions. The results are shown as below. Using the data, answer the questions.

Making a Book Sale Histogram

Ted goes to the market and sells books on 20 consecutive days. The sales results are shown as below; he already organized them in order.

Reading Histograms Lesson

According to this histogram, which is the most favorite outdoor activity?

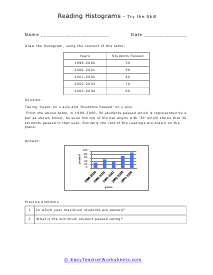
Reading Histograms

From the above table, in 1999-2000, 30 students passed which is represented by a bar as shown below. As seen the top of the bar aligns with ‘30’ which shows that 30 students passed in that year. Similarly the rest of the readings are drawn on the plane.

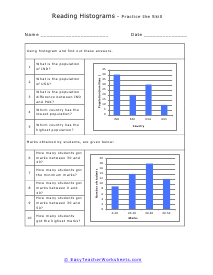
Countries and Grades

What is the population difference between IND and PAK?

Practice Worksheet

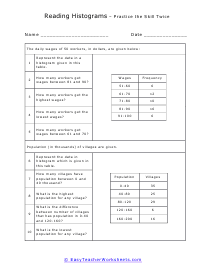
Workers and daily wages.

Interpret the Worksheet

Height of the 100 students and the Toys produced (in millions) by countries.

Warmup Worksheet

You make the Answer Key for yourself.