These worksheets teach your students how to create and use line graphs to track data.

What Are Line Graphs? Let's take a look at what they are one by one, and then we can move on to learn how you can read them! A graph is a visual illustration of data that is too big and too complicated to be written in text. And a line graph is a type of graph. And trust us, they are super helpful! There is so much that you can learn from looking at one of them. A line graph usually looks like a graph looks like a connect-the-dots puzzle; these dots and the line connects the dot to make a representative of the information. Line graphs can be straight, curved, or dotted! Reading line graphs is very easy. There are two axes, the x, and the y-axis, that have the numbers and values. These values represent the data of the question, and the line represents the highs and lows. The higher the line, the greater the value, and the lower the line, the lower the value.

We use line graphs to get a picture of a value over time. For example if you wanted to track the amount of money you had in the bank, you would have twelve bars over the course of a year to display this. If we are trying to compare two data sets, a line graph could have two lines. This is really helpful to do when we are trying to find relationships between two different sets of data. These worksheets explain how to read and plot line graphs. Sample problems are solved and practice problems are provided. Your students will use these activity sheets to learn how to create line plots to track data points that change over time. Students will also learn how to construct line plots.


Get Free Worksheets In Your Inbox!


Print Line Graph Worksheets

Click the buttons to print each worksheet and answer key.

How to Make a Line Graph Lesson

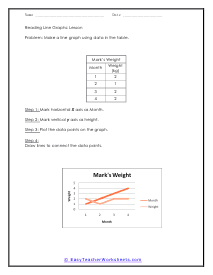
This worksheet teaches how to make a line graph to convey information. A sample problem is solved, and a practice problem is provided.

Reading a Line Graph Worksheet

Students will read a line graph and use its information to answer questions.

Reading a Double Line Graph Worksheet

Students will read a double line graph and use its information to answer questions.

Practice

Students answer questions using information in a double line graph.

Double Drill

Mrs. Megan's class is having a Field Day. One of the events is a relay race.

Skill Check

What is the ratio of the population of New Hampshire in 1940 to 2000?

Independent Practice

The Dow Jones Industrial Average (DJIA) is one way to measure the American stock market. The DJIA increases when the American economy is strong and decreases in a recession. This chart shows how the DJIA decreased in 2008 compared to 2007 when the country entered a depression. The DJIA was about the same in the first 4 months of each year.

Making a Line Graph Worksheet

A dog breeder has two miniature dachshund puppies and she measures their weight for six weeks. Make a separate line graph for each puppy. Decide what scale is best for the y-axis (weight of the puppy) based on the data.

Practice

A car dealership keeps track of how many cars are sold each week. Make a line graph of the number of cars sold.

Making a Double Worksheet

Your family is planning a vacation and you have decided to visit Little Rock, Arkansas (AK) or Billings, Montana (MT). To help you decide which location and what month you make a line graph to compare the average temperature for each month in both locations. Be sure to provide all labels.

Double Line Practice

The coach is keeping track of improvement in performance of two athletes (A1 and A2) by tracking the percent of training exercises each one completes successfully over 10 training sessions. Graph the coach’s data. Be sure to provide all labels.

Plotting Rainfall Drill

Make a line graph to compare the average rainfall in inches for each month in Maine (ME) and Iowa (IA).

Line Graphs Lesson

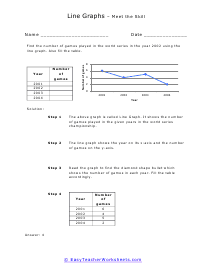
This worksheet explains how to read a line graph and use its data to solve a problem. A sample problem is solved.

Super Bowl Points Lesson and Practice

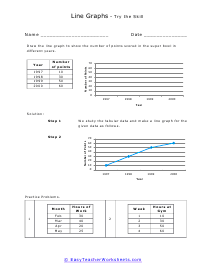
Draw the line graph to show the number of points scored in the super bowl in different years.

Worksheet

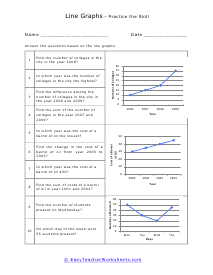
Find the change in the cost of a barrel of oil from year 2000 to 2003?

Read Them Practice

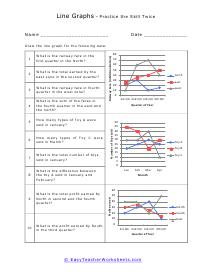
What is the total profit earned by North in second and the fourth quarter?

Line Graphs Drill

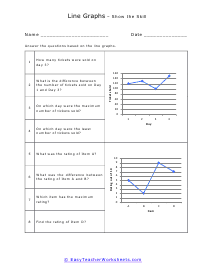
Given line graphs for reference, students will answer the questions. Eight problems are provided.

Plot Them Warm Up

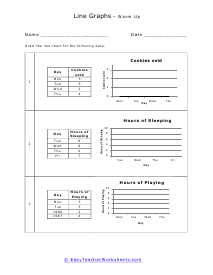
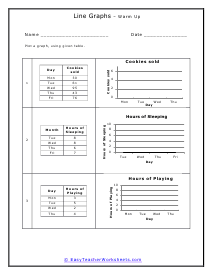
Students will plot data on line graphs. Three problems are provided.

Plotting Line Graphs Lesson

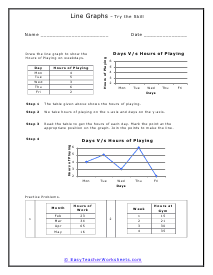
This worksheet explains how to plot lines on a graph. A sample problem is solved.

Lesson and Practice

Draw the line graph to show the Hours of Playing on weekdays.

Draw Your Line Worksheet

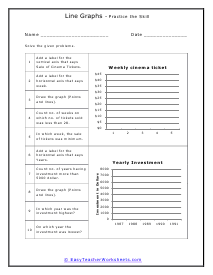
Add a label for the horizontal axis that says week.

Connect It Practice

Connect all the plotted points provided and answer the questions.

Plotted Drill

Given points plotted ion a line graph for reference, students will answer the questions. Eight problems are provided.

Warm Up

Students will plot data on line graphs. Three problems are provided.

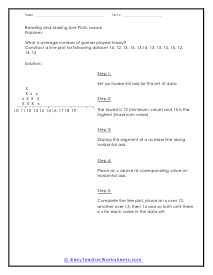
Reading and Making Line Plots Lesson

This worksheet explains how to read and make line plots. A sample problem is solved.
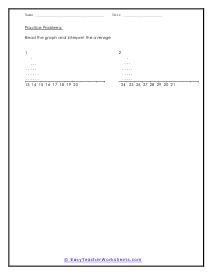
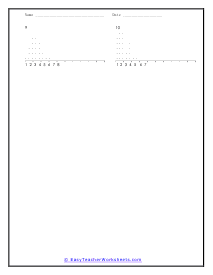
Practice Problems

Students practice reading graphs and interpreting the average. Two practice problems are provided.

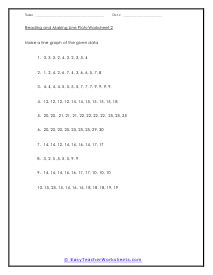
Averages Worksheet Part I

Students will read graphs and find the average.

Averages Worksheet Part II

Students will read graphs and find the average. The last two of the previous worksheet.

Plots Practice

Students will practice reading graphs to find the answers to questions.

Review and Practice Part I

Students will review how to construct a line plot to determine an average number. A sample problem is solved.

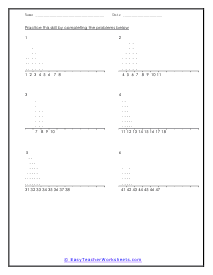
Review and Practice Part II

Students will practice using line plots. Six practice problems are provided.
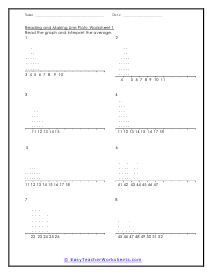
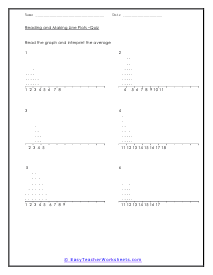
Line Plots Quiz Part I

Students will demonstrate their proficiency in reading graphs and finding the average. The first six of

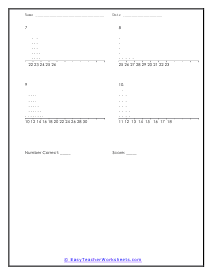
Line Plots Quiz Part II

This should help them feel better after mastering this quiz.

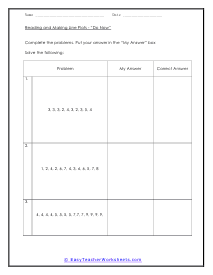
Reading and Making Skills Check

Students will make line plots to find the average of a set of numbers. Three problems are provided, and space is included for students to copy the correct answer when given.
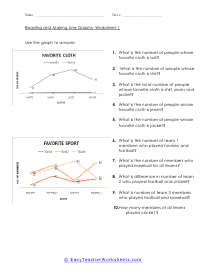
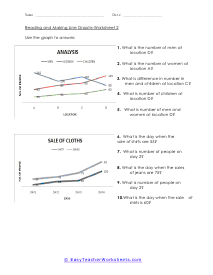
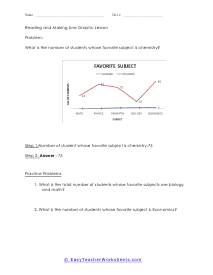
Reading and Making Line Graphs Lesson

What is the number of students whose favorite subject is chemistry?

Worksheet

How many team 1 members played hockey and football?

Practice

What is difference in number in men and children at location C?

Triple Line Review

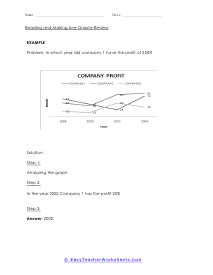
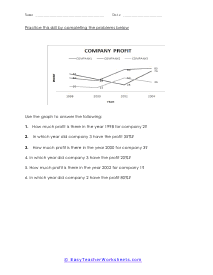
The concept of how to read and interpret data on a triple line graph. A sample problem is solved.

Triple Line Graphs Drill

How much profit is there in the year 1998 for company 2?

Single and Double Quiz

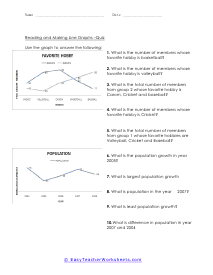
What is the number of members whose favorite hobby is basketball?

Skill Check

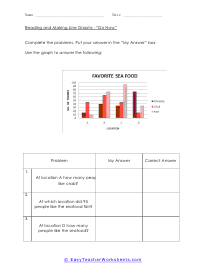
At which location did 95 people like the seafood fish?

Reading Line Graphs Lesson

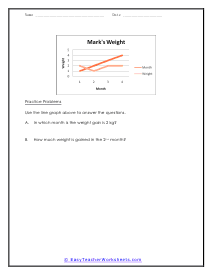
This worksheet explains how to read a double line graph. A sample problem is solved.

Practice Problems

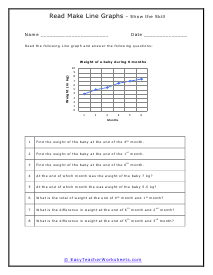
How much weight is gained in the 2nd month?

Worksheet

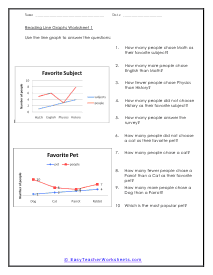
How many people chose Math as their favorite subject?

Practice

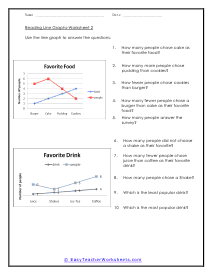
How many fewer people chose a burger than cake as their favorite food?

Reading Line Graphs Review Worksheet

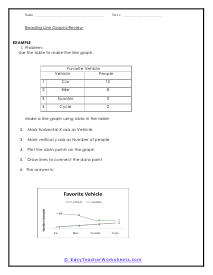
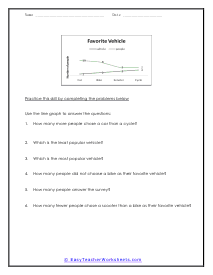
The concept of how to read and interpret data on a line graph is reviewed. A sample problem is solved and six practice problems are provided.

Reading Drill

How many fewer people chose a scooter than a bike as their favorite vehicle?

Reading Them Quiz

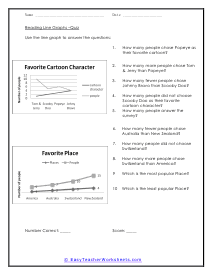
Students will demonstrate their proficiency in working with line graphs.

Cars Check

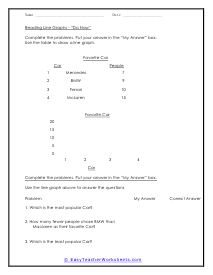
How many fewer people chose BMW than Maclaren as their favorite Car?

Meet the Skill

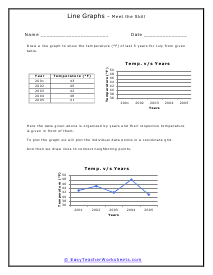
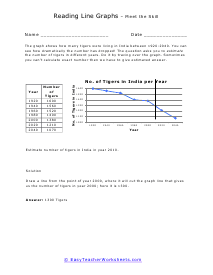
The graph shows how many tigers were living in India between 1920-2040. You can see how dramatically the number has dropped! The question asks you to estimate the number of tigers in different years. Do it by tracing over the graph. Sometimes you can’t calculate exact number then we have to give estimated answer.

Estimating Skill

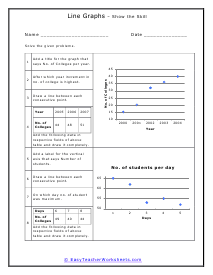
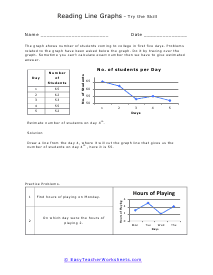
The graph shows number of students coming to college in first five days. Problems related to the graph have been asked below the graph. Do it by tracing over the graph.

Practice the Skill

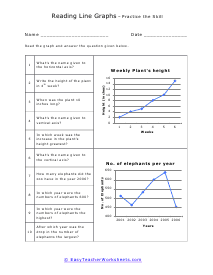
After which year was the drop in the number of elephants the largest?

Skill Worksheet

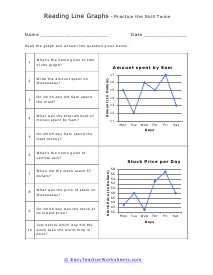
Just before which day did the stock take the worst drop in price?

Oil Prices and Ticket Prices

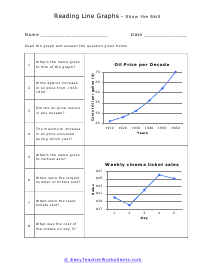
The maximum increase in oil price occurred during which year?

Books Sold Warm Up

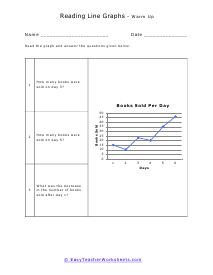
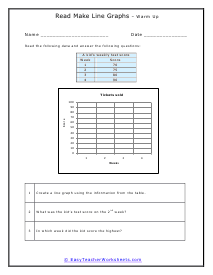
What was the decrease in the number of books sold after day 1?

Read/Make Line Graphs Review and Practice

Students will practice creating line graphs. Two practice problems are provided.

Solving Line Graph Problems Worksheet

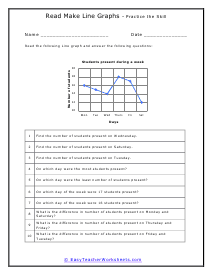
What is the difference in number of students present on Monday and Saturday?

More Practice

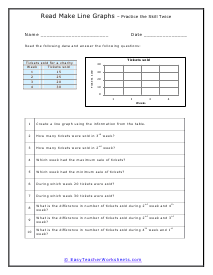
What is the difference in number of tickets sold during 2nd week and 4th week?

Read/Make Line Graphs Drill

Students will demonstrate their proficiency in working with line graphs.

Class Warm Up

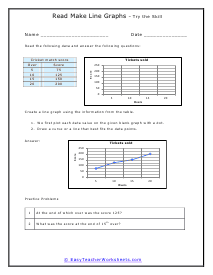
Create a line graph using the information from the table. Students will answer questions referring to the line they created.

Graphing Data Values

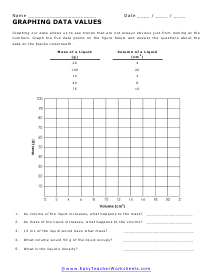
Graphing our data allows us to see trends that are not always obvious just from looking at the numbers. Graph the five data points on the figure below and answer the questions about the data on the blanks underneath.