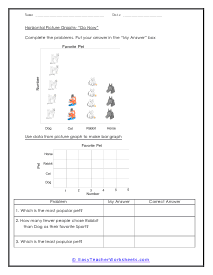
These worksheets will teach your students how to convert simple pictographs into related bar graphs.

What are Horizontal Picture Graphs Used For? Whenever you go on to study math, do you think that the subject is boring? Well, everyone thinks that there is not a single thing about math that makes sense and could b fun or interesting to study about. But that's not true! Math has its fair share of exciting topics that is remarkably interesting and very fun to learn about! Have you heard about what picture graphs are? More importantly, do you know what graphs are? Let us take a look at what they are one by one, and then we can move on to learn how you can read line graphs! A graph is a visual illustration of data that is too big and too complicated to be written in text. And a line graph is a type of graph. And trust us, picture graphs are so cool! There is so much that you can learn from looking at a picture graph. Reading line graphs is extremely easy. There are two axes, the x, and the y-axis, that have the numbers and values. These values represent the data of the question, and the pictures represent the highs and lows. The greater the number of pictures, the greater the value, and the lower the number of pictures, the lower the value.

These worksheets focus on using pictographs that move in a left or right direction. This is usually the second step in a student's graphing career. The next logical step is bar graphs, which if you look at pictograms close enough, you can see the bars that are made by the images within it. We help students work on the conversion from step one to step two. These worksheets explain how to read horizontal picture graphs. Your students will use these activity sheets to learn how to convert simple pictographs (where a given number within a data set is represented by an icon) into a related bar graph.


Get Free Worksheets In Your Inbox!


Print Horizontal Picture Graphs Worksheets

Click the buttons to print each worksheet and associated answer key.

Horizontal Picture Graphs Lesson

This worksheet explains how to read and construct line plots. A sample problem is solved.

Print Now!

Lesson and Practice

Which fruit do people like the most? In order to find the fruit which is liked by most people, look at the bar which is at the highest point. The bar for banana is the maximum, which is at 4. So bananas are liked by most of the people.

Practice the Skill Worksheet

Students will read horizontal picture graphs to answer questions for example: Which subjects is liked by the least number of students?

Picture Practice

Use data from picture graph to make a bar graph and answer the questions.

Horizontal Drill

Given data, students will create a horizontal picture graph that they will use to answer questions. Eight problems are provided.

Horizontal Picture Graphs Warm Up

Students will practice reading horizontal picture graphs. Three problems are provided.

Creating Graphs for Graphs Lesson

Enter the result in to the bar graph by creating bars that extend from the “subject” on the vertical axis up to the number of vote.

Try the Skill

Students will practice reading horizontal picture graph about favorite school subjects. Two practice problems are provided.

Reading Horizontal Picture Graphs Worksheet

Students will read horizontal picture graphs to answer questions. Ten problems are provided.

Reading Horizontal Picture Graphs Practice

How many more people chose papaya than pineapple?

Reading Horizontal Picture Graphs Review

The concept of horizontal picture graphs is reviewed. A sample problem is solved.

Horizontal Picture Drill

Students will practice reading horizontal picture graphs. Six problems are provided.

Reading Horizontal Picture Graphs Quiz

Students demonstrate their proficiency reading horizontal picture graphs. Ten problems are provided.

Skill Check Worksheet

Students will answer questions using the horizontal picture graph that is provided. Three problems are provided, and space is included for students to copy the correct answer when given.