These worksheets teach your beginning students how to build, interpret, and read stem and leaf data tables.

Stem and leaf plots are a way to visually show the frequency with which certain categories of value occur. The stem is the left hand column contains the tens digit. The leaves in the right hand column contain the digits for each twenties, thirties and forties. We use stem and leaf plots process for displaying the frequency with which specific classes of figures occur. You made frequency distribution table or histogram for the expression and you can use a stem and leaf plot. Then, you will see the same information.

In these worksheets, students will learn how to draw stem and leaf plots. They will then use the plots that they have drawn to answer questions. These worksheets explain how to read and interpret simple stem and leaf data tables. It also includes ample worksheets for students to practice independently.


Get Free Worksheets In Your Inbox!


Print Stem and Leaf Plots Worksheets

Click the buttons to print each worksheet and associated answer key.

Lesson and Practice Worksheet

This worksheet explains how to use these types of plots to find the median and the mode. A sample problem is solved.

Lesson and Practice 2

Students will learn how to make and interpret plots for a given data set. A sample problem is solved and two practice problems are provided.

Independent Worksheet 1

Students will build use plots to answer questions. Ten problems are provided.

Practice Sheet 2

Students will practice building stem-leaf and use them to answer questions. Ten problems are provided.

Skill Drills

More practice on the same system of problems we have been seeing here. Eight problems are provided.

Warm Up Activity

Students will warm up by building plots and then taken them to answer higher level questions. Three problems are provided.

Understanding the Data Tables Lesson

Students learn how to read and interpret simple stem and leaf data tables. A sample problem is solved.

Lesson and Practice Worksheet

Students will work with same level tables. A sample problem is solved and two practice problems are provided.

Data Tables Worksheet

I wish I took three levels of questions to that next level.

Tables Practice Worksheet

Students will examine questions using simple stem and leaf data tables. Ten problems are provided.

Skill Drill Packet

Given simple stem and leaf data tables, students will answer questions. Eight problems are provided.

Skill Warm Up

Get warmed up with this skill. Three really nice examples of problems to get your hands warm.

Overall Lesson and Practice

This is an overall skill task master. You will learn and then get some practice with it.

Practice Worksheet

Why not try a mix of different types of questions? Ten problems are provided.

Practice Moves

Putting ten on three. Which pieces of data expand the most in this setting?

Review and Practice

The concept of simple stem and leaf data tables is reviewed. A sample problem is solved and six problems are provided.

Skill Quiz

Students demonstrate their proficiency working with simple stem and leaf data tables. Ten problems are provided.

Skills Check

This is a great way to gauge where your students are at with this skill. Three problems are provided, and space is included for students to copy the correct answer when given.

What Do Stem and Leaf Plots Look Like?

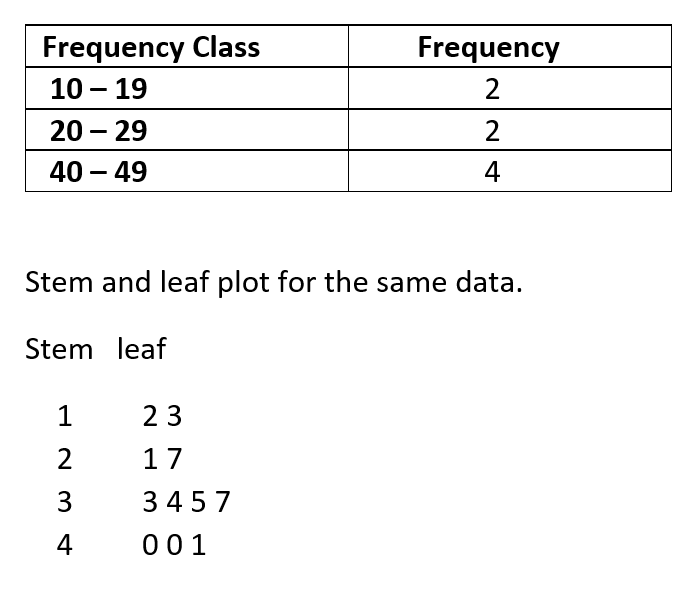
For example, supposition list of the values that is 12, 13, 21, 27, 33, 34, 35, 37, 40, 41. Make the frequency distribution chart and show the quantities of tens, twenties, thirties, and forties.

Stem and Lef Plot Example

Stem is the left-hand column which has tens values. Leaves are the right-hand column that contain all the ones figures for every ten, twenties, thirties, and forties. Here, still, you need to determine the original value from that leaf at the bottom and three values in the forties were 40, 40, and 41. Remember that horizontal leaves in the stem and leaf plot are similar to the vertical bars in the histogram. Leaves have lengths that are equal to the numbers in the frequency column of the frequency table.