If we are given two points that exist on a straight line, we can begin to determine how we can replicate that line by finding the equation of the line. The equation of a line is usually written in the form of y = mx +b. x and y are just the coordinate value of x and y. m is the slope or steepness of the line and b is the y-intercept (where the line crosses the y-axis) of the line. You can start determining the equation by first finding the slope by finding the difference of the y values of your two point divided by the difference of their x value. Plug that slope value and your point values into the equation to solve for b.
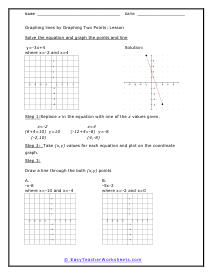
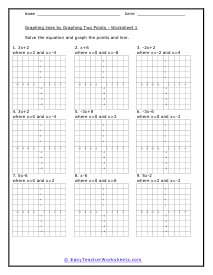
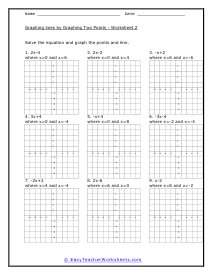
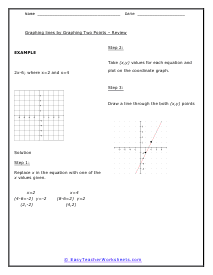
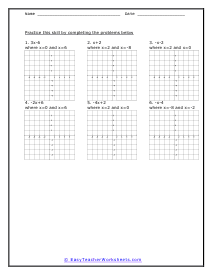
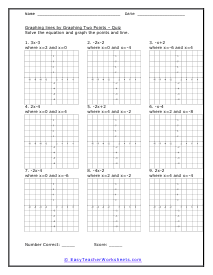
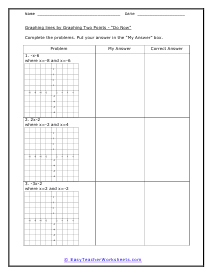
How to Graph a Line from an Equation? Did you know that you could plot a line on a graph using its equation? Well, now, you know. An equation of a line can be used to plot a line on the graph. The general equation of a line is given by; y = mx+c. Here x and y are the variables, m is the slope or gradient, and c is the y-intercept. The y-intercept is given by the coordinate (o, c). For other points, you can make a coordinate table using random points. The most general points are -1, 0, 1. It will give you the x-intercept along with the other two points to plot on the graph. These worksheets explain how to construct simple line plots using two coordinate point pairs. Students will solve equations using given values to determine the coordinate points.