A linear inequality is an expression that when plotted creates a line on a graph. They are just like linear equations, but they are lacking the equals symbol in favor of a less than, less than or equal, greater than, or greater than or equal. In this section we examine how to take an expression and visualize it on a graph. The first step will be to get the inequality into a standard linear format (y = mx + b), less the equals symbol. This will often involve getting the y-value by itself. We then plot this value on graph as we would when we are drawing a line. To display the inequality, we shade section of the graph above or below the line to show all the possible values. If it is greater than, we shade above the line and if it is less than we shade below the line.
These worksheets explain how to graph linear equations, including those containing inequalities. Students will also be asked to calculate missing coordinate points given a graph line.
Get Free Worksheets In Your Inbox!
Print Graphing Inequalities Worksheets
Click the buttons to print each worksheet and answer key.
Assume values of x and find out value of y. Show all three points (x, y) on the graph. If the point makes the inequality true, shade that side of the line.
Maria deposits $35,000 on an account with 10% simple interest. The equation M =
3500y + 35,000 tells how much money (M) she has on her account after y years
(interest + principal).
How Do You Graph Inequalities?
Graphing inequality is a lot like graphing equations. To graph an inequality, you must follow the following steps. The foremost step is to draw the graphs of 'equal' lines, then create the shade in the correct area.
Having it with an example makes it clearer. Just follow the example.
There are mainly three steps to graph inequality:
The first is to rearrange the equation, so 'y' is on the left and everything else on the right.
Plot the 'y =' line (make it solid line for y≤ or y≥ , and a line of a dash for y< or y>)
Then lastly, shade the above-given line for a 'greater than' (y> or y≥), or you can also draw the line below for a ‘less than’ (y< or y≤).
See the example to graphical examples to have a more explicit context.
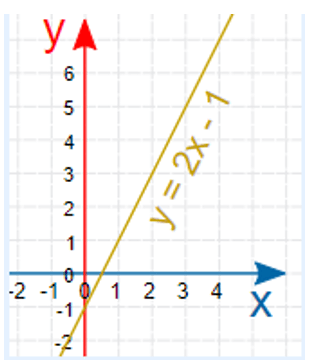
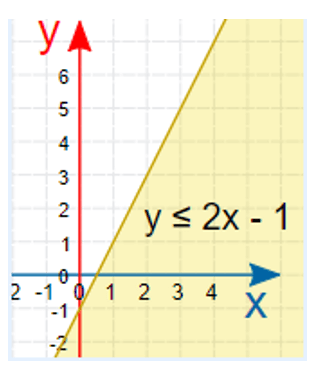
Example: y ≤ 2x-1
1. The inequality already has "y" on the left and everything else on the right, so no need to rearrange
2. Plot y=2x-1 (as a solid line because y ≤ includes equal to)
3. Shade the area below (because y is less than or equal to)