These activity sheets teach your students how to graph linear systems, including those with inequalities.

A system of linear inequalities is when you have two separate inequalities that are related in that they share the same variables. To solve these you need to determine the order pair that is the solution to both inequalities. To display the solution we often graph all of the possible solutions by shading. These problems can be solved algebraically or by graphing both inequalities. To solve graphically, plot and shade each inequality on a graph. The solution is where both inequalities intersect.

A system of inequalities is a set or type of two or more inequalities in one or more variables form. Systems of inequalities are used when a problem requires a different range of solutions, and there is one more additional constraint on those solutions. Just have the idea with the example. Jack is the manager of a well-established textile factory. His workers have a total of 400 person-hours this week for him to allocate. The target is settled as every ten shirts will take 2 hours to produce, and every ten pairs of pants will take 3 hours to produce. Jack has a set target to manufacture at least 30 shirts and 20 pairs of pants this week. How will Jack allocate his person-hours, and how will his production get ready on time? This is where the system of inequalities will do the job. The mathematical formula of inequalities will make Jack decide what he needs to do the correct allocations. These worksheets explain how to graph linear systems, including those with inequalities. Students will require colored pencils in order to shade some answers according to directions.


Get Free Worksheets In Your Inbox!


Print Graphing Systems of Inequalities Worksheets

Click the buttons to print each worksheet and answer key.

Graphing Linear Systems Lesson and Practice

For both equations, assume values of x and find the value of y. Show all three points (x, y) on graph. Draw both lines. The point of intersection of the two lines (1, 5) is the solution to the system of equations.

Worksheet

Students will practice graphing linear systems Nine problems are provided.

Practice

Solve the following system of equations graphically. Find the area by drawing given lines on graph paper.

Review and Practice Page 1

The point of intersection of the two lines (1, 7) is the solution to the system of equations.

Review and Practice Page 2

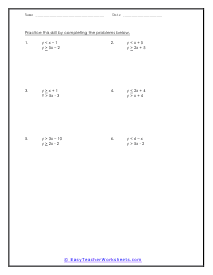
This worksheet reviews the concept of how to transform into a graphic. On this page, six practice problems are provided.

Quiz

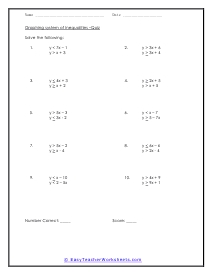
Students demonstrate their proficiency graphing linear systems. Nine problems are provided.

Skills Check

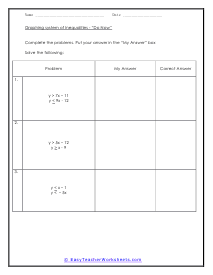
Prepare a graph and find where the lines intersect. Along with two other skills that you have some experience with.

Graphing Systems of Inequalities Lesson and Practice

: If the point makes the inequality true, shade that side of the line. If the point does not make the inequality true, shade the opposite side of the line.

Worksheet

Students will solve each problem by graphing the expression. Nine problems are provided.

Graphing Systems Practice

Students will determine if the statements are true or false by graphing the equations. Nine problems are provided.

Review Page 1

This worksheet shows you step by step how to plot these value on a graph.

Practice Page 2

This worksheet reviews how to solve for systems of inequalities. On this page, six practice problems are provided.

Quiz

Students demonstrate their proficiency solving for systems of inequalities. Nine problems are provided.

Skills Check

A nice way to plot this stuff on a graph.