These activity sheets will give your kindergarten students practice in creating simple picture graphs and tables.

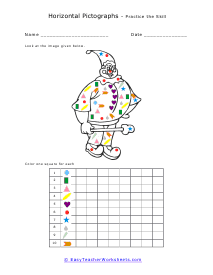
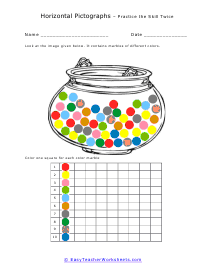
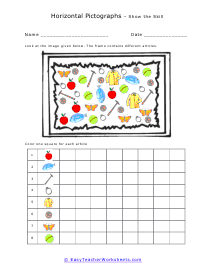
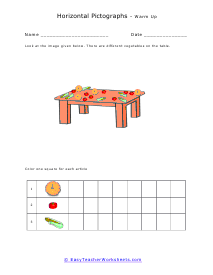
Just like sometimes we use pictures to describe objects, we use graphs and charts to display statics in some mathematical questions. Pictographs are used in all types of materials to help clear explain data. A pictograph is a visual representation of data through the use of images. Each image that is placed on the graph represents a fixed value of data. When you are creating a pictograph you will go through several stages. Pictographs are mostly used in writing and graphic systems where the characters can be displayed through a picture. Pictograms are often used in various other subjects such as geography, leisure, and tourism.

You start by collecting your data, in many cases it will already be provided for you. Then comes the fun part, you pick your own symbol to represent the data. After that you just draw your pictograph. Your students will use this collection of worksheets to practice creating simple graphs and tables based on given information. They are called pictographs because they are simply picture graphs. Students will draw items in bar graphs or color in spaces, as directed.


Get Free Worksheets In Your Inbox!


Pictograph Worksheets

Click the buttons to print each worksheet and answer key.

Pictographs Lesson

The table that is given shows the number of balls of different colors in a room. The number of balls of each color is written against their color in the table. Create a pictograph based on this data.

Print Now!

Lesson and Practice

Read the number that is written against each subject. This number represents the number of books of each subject that Paul has. Draw as many books as the number written in each column. So, we draw 3 books for English and 2 for science.

Candy Worksheet

Make a visual to display how many candies each child has. There are ten pieces of data to plot out.

Pictographs Practice

Students will create a simple graph using information provided. Ten pieces of data to work with.

My Pack of Drills

The number of students who like a particular sport is written next to the name of the sport in the table. Students will create a simple pictograph to display this. Eight sports are included on the table.

Warm Up

Students demonstrate your ability with working on pictographs. Three types of animals are included.

Horizontal Pictographs Lesson

Students review how to create a horizontal pictograph. A sample problem is solved.

Lesson and Practice

Students will break down things that are found within an ice cream sundae.

Clowning Around Worksheet

You will plot out a diagram to show data from a clown picture.

Practice

Look at the image given below. It contains marbles of different colors. Plot out all the marbles found in the bowl.

Horizontal Pictographs Drill

Given a heap of information, the students will create a horizontal pictograph. Eight sections of data for you to display.

Horizontal Pictographs Warm Up

Students demonstrate skill in creating horizontal pictographs by plotting the three things that are found on top of the table.