How to Graph Quadratic Functions? What are quadratic functions? Quadratic functions are the ones where the highest power of the variable is 2. You can even graph these functions and it is pretty simple. The general form of a quadratic function is given by; f(x) = ax2 + bx + c The basic curve of a quadratic function is a parabola. To graph such equations; you can take a similar approach as that of graphing a linear graph. You take random values of x and find the corresponding values of the function. You plot the values of x on the horizontal axis and the values of the function on the vertical axis. This is how you graph a quadratic function.
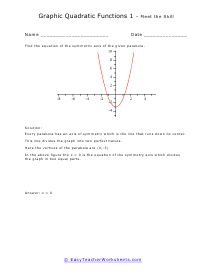
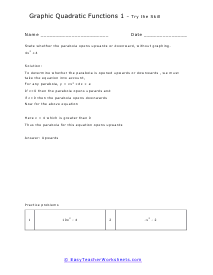
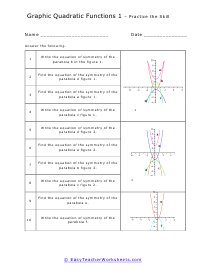
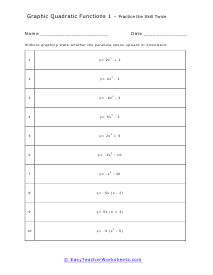
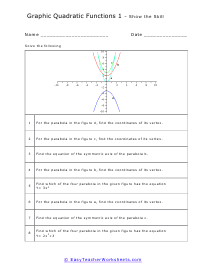
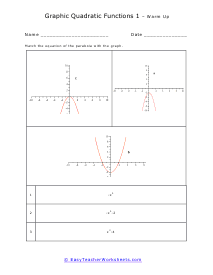
Your students will work with quadratic functions. When graphed, a quadratic function is a curve called a parabola. They will learn to determine the equation for a parabola based on studying its graph. The will learn how to find the equation of the symmetric axis of a given parabola. They will determine whether a parabola opens upwards or downward by studying the equation (without graphing), write equations of symmetry for parabolas, determine the coordinates of the vortex of given parabolas, and match equations for parabolas with their graphic representations. This set of worksheets contains step-by-step solutions to sample problems, both simple and more complex problems, a review, and a quiz. When finished with this set of worksheets, students will be able to recognize basic properties of a parabola by studying its equation. These worksheets explain how to determine what the graph of a parabola will look like when given its equation. Sample problems are solved and practice problems are provided.