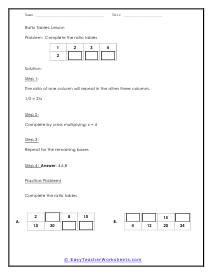
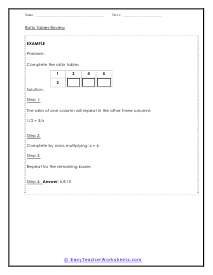
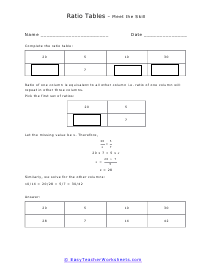
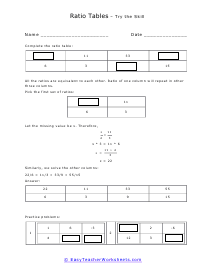
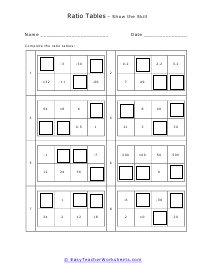
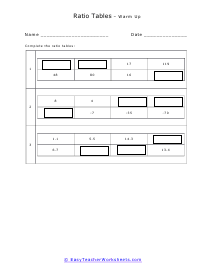
A ratio table is a set of equivalent (equal value) ratios presented in a table, in order to understand the relationship between the ratios and the numbers. In a ratio table, the ratio in one column repeats in all the other three columns. You get practical information to solve ratio problems by ratio tables. It is a structured list of equivalent ratio that has an equal value. By using and learning it, you can understand the relationship between ratios and the numbers. Example - Perhaps, you wish to ride a bike in your community, and you want to know whether your speed is consistent throughout all your various adventures. During each trip, you measure the length of your trip with a stopwatch, and you use the bike's odometer to measure the distance. Make a table and note down all your trip's measurements like destination point, time the round takes, and how far it is. Then, find the average speed of each trip and determine if it is the same for each ratio. As a result, you will divide the distance by time for a single round. After all these measurements, you will see that you are consistent. You will get the total time of travel is 20 feet per second regardless of a specific riding route or point.
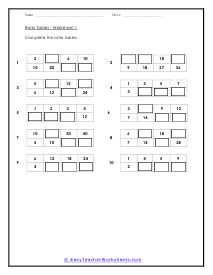
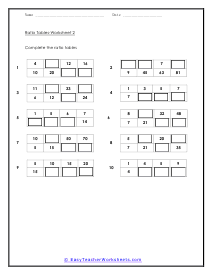
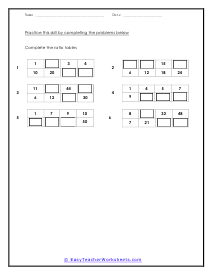
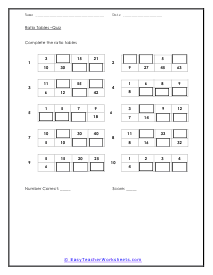
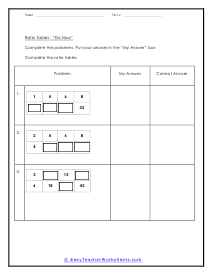
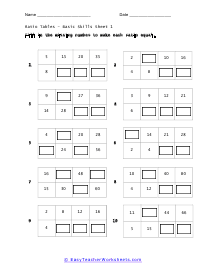
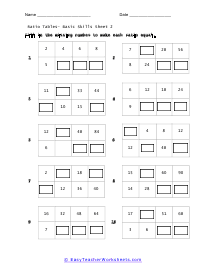
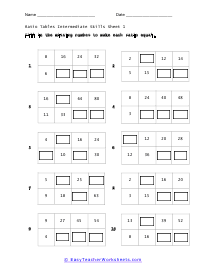
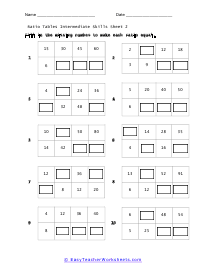
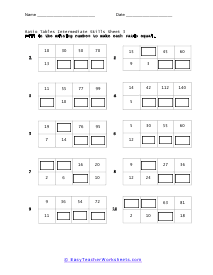
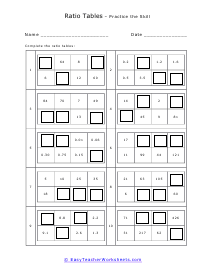
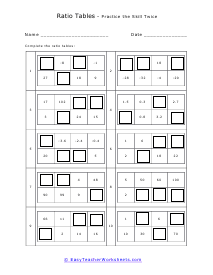
In these worksheets, your students will work through this skill in a wide array of activities. There are up to five ratios per table; in most instances students are required to complete three or four blanks. This set of worksheets contains step-by-step solutions to sample problems, both simple and more complex problems, a review, and a quiz. It also includes ample worksheets that can be used for independent practice. Problems are provided at both the basic skills and the intermediate skills levels. When finished with this set of worksheets, students will be able to complete the tables, and will understand the relationship between the ratios and the numbers. These worksheets explain how to complete tables that are presented with ratios. Sample problems are solved and practice problems are provided to get you started.