In these worksheets, students will learn to work with box and whisker plots.

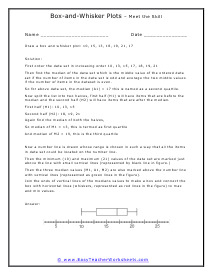
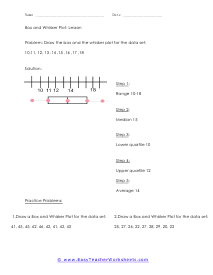
In mathematics, there is always a need to read and interpret data. It is where the branch of statistics comes into play. Statistics is a type of mathematical analysis that utilizes quantified models along with synopses and representations. It allows gathering, reviewing, analyzing, and evaluating data. Known as box plots, box and whisker diagrams, the box and whisker plots are one of the many ways of representing data. It is used to visually display the variation in a data set through a graphical method. It provides additional information in comparison to the usual histogram representation. It allows displaying multiple data sets on a single graph. These plots can effectively summarize data that is sourced from multiple places. It also makes a comparison of data of different categories easy, leading to effective decision making. Some examples where these plots are used include T-test scores comparison between classrooms, data comparison between pre- and post-process change, and data from two duplicate machines while manufacturing the same product. A box and whisker plot is a diagram that displays the median, quartiles, and extremes of a set of data on a number line to visually portray the distribution of the data.

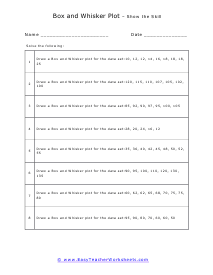
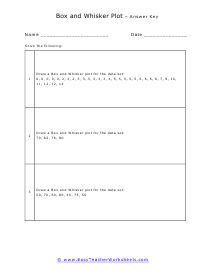
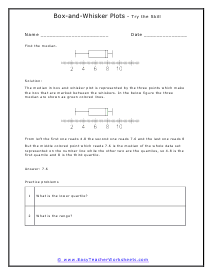
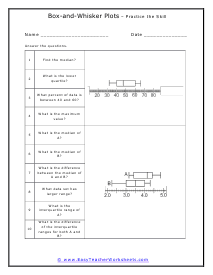
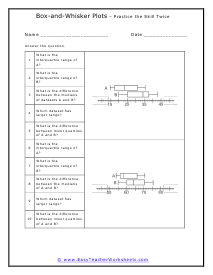
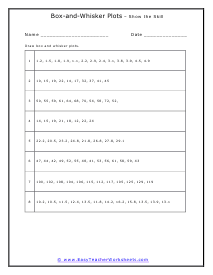
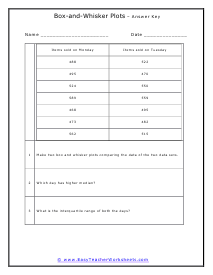
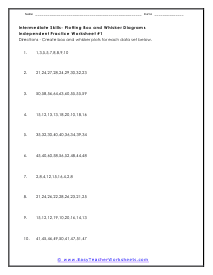
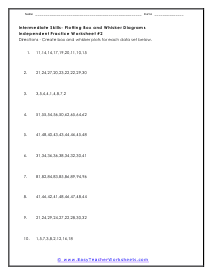
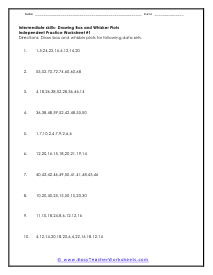
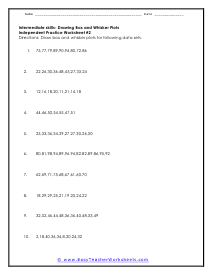
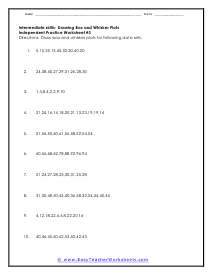
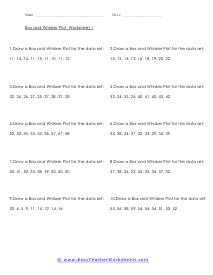
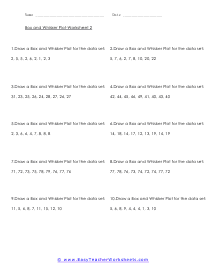
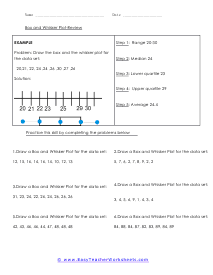
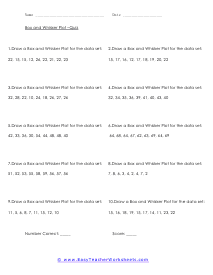
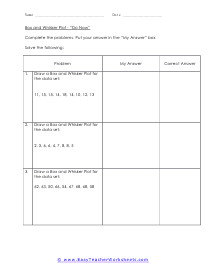
In these worksheets, students will work with box and whisker plots. They will draw box and whisker sets for given data sets. They will read and interpret box and whisker plots. They will also answer questions by referring to box and whisker plots. Additional paper may be required. This set of worksheets contains step-by-step solutions to sample problems, both simple and more complex problems, a review, and a quiz. It also includes ample worksheets for students to practice independently. Worksheets are provided at both the basic and intermediate skills levels. When finished with this set of worksheets, students will be able to draw, read, and interpret box and whisker plots. These worksheets explain how to draw, read, and interpret box and whisker plots. Sample problems are solved and practice problems are provided.


Get Free Worksheets In Your Inbox!


Box and Whisker Plots Worksheets

Click the buttons to print each worksheet and answer key.

Lesson

This worksheet explains how to process this skill. First step is to rewrite the data in increasing order. Find the median of all the numbers, find the lower and upper median.

Print Now!

Lesson and Practice

Students will review how to draw a box and whisker plot for a given set of numbers. A sample problem is solved and two practice problems are provided.

Box and Whisker Plots Worksheet

Students will work on their own to create their very own box and whisker plots for a given set of numbers. Ten problems are provided.

Practice

Take a stream of data and give it purpose and a source of understanding by drawing a box and whisker plot. Ten problems are provided.

Drill

Students will draw box and whisker plots for a given set of numbers. Eight problems are provided.

Warm Up

Students will warm up with how to visualize data to better interpret it. Three problems are provided.

Using Box and Whisker Plots Lesson

This lesson covers how to completely to draw a box and whisker plot for the data set: 10, 15, 13, 18, 19, 21, 17. First order the data set in increasing order 10, 13, 15, 17, 18, 19, 21 Then find the median of the data set which is the middle value of the ordered data set if the number of items in the data set is odd and average the two middle values if the number of items in the dataset is even. So for above data set, the median (A1) = 17 this is named as a second quartile. Now split the list into two halves, first half (H1) will have items that are before the median and the second half (H2) will have items that are after the median. First half (H1): 10, 13, 15 Second half (H2): 18, 19, 21 Again find the median of both the halves, So median of M1 = 13, this is termed as first quartile And median of M2 = 19, this is the third quartile. We then go on to drawing.

Lesson and Practice

Students will review how to read and interpret box and whisker plots. A sample problem is solved and two practice problems are provided.

Worksheet

Students will answer questions referring to box and whisker plots that are already drawn for you. Ten problems are provided.

Practice

We move from drawing them to interpreting box and whisker plots. Ten questions are provided.

Drill

Students will construct box and whisker plots. Eight problems are provided.

Monday's and Tuesday's Sales

Make two box and whisker plots comparing the data of the two data sets.

Making Box and Whisker Diagrams Intermediate Skills Worksheet

Students will demonstrate intermediate skills in constructing box and whisker plots. Ten problems are provided.

Intermediate Skills Practice

Students will practice intermediate skills by constructing these visuals from data sets. Ten problems are provided.

Intermediate Skills Drill

We get some more work on these skills by solving helpful problems.

Drawing Box and Whisker Plots Intermediate Skills Worksheet

Students will focus on drawing these diagrams at the intermediate level. Ten problems are provided.

Intermediate Skills Practice

The data is a bit more complex to work with.

Lesson

Students will learn to draw a box and whisker plot for a given data set. A sample problem is solved and two practice problems are provided.

Working with Box and Whisker Plots Worksheet

We will get much more practice constructing these diagrams with the help of ten sets of data.

Practice

We are getting good at this skill and getting ready to take it to the next level. Ten problems are provided.

Review

Students will review how to draw box and whisker sets for the given data sets. A sample problem is solved and ix practice problems are provided.

Quiz

Students will demonstrate their proficiency with this skill. Ten problems are provided.

Check

Why not give yourself some work to get better at this?