Bias in data science is the branch of statistics that we use to measure the level of the record you have. It is entirely different from expectations of what you have collected. If you talk about its fundamental perspective, the bias fundamental relates to a fault in the validity of what you are pondering. Remember, all the mistakes will very subtle or the error that you may ignore. The data that we use for training is the central focus of predictive models. Even, in reality, they are aware of the absence of other reality in this process of forming a bias. The model's accuracy and fidelity need to compromise when you find systemic biased. With significant stakeholders, the models of biased data restrict the credibility of the information. The worst situation occurs when biased models actively distinguish against a specific set of people. It would be best if you had to be well aware of such perils, especially during the information entry process. A analytical scientist can easily and quickly remove all the errors from the data with this awareness. As a result of the process of forming unbiased values, higher-quality models become efficient in improving analytics adoption and increasing the value of analytics investment. The major types of bias : Confirmation bias - lacking a full confirmation that your data is biased. Selection bias - it refers to the error confirmation in subjectively selected data. Outliers - it relates to the presence of extreme value. Overfitting and underfitting - this kind of bias works when it becomes able to give an oversimplistic picture of reality. Confounding variables - It is not famous compared to another existing analytical model. It impacts both the explanatory variable and the dependent variable.
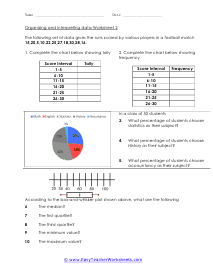
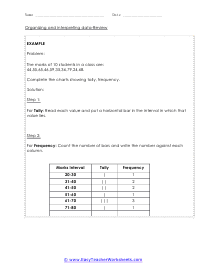
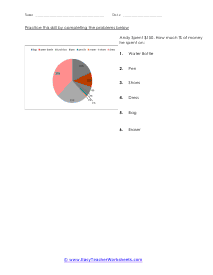
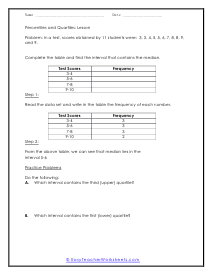
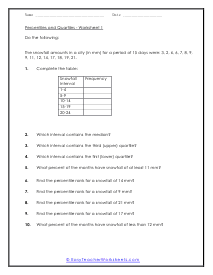
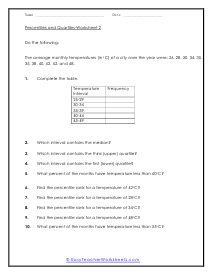
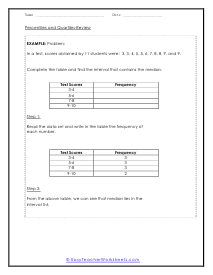
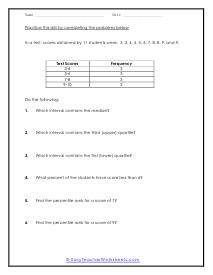
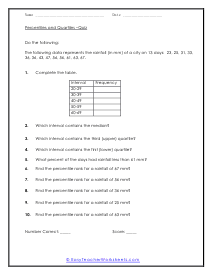
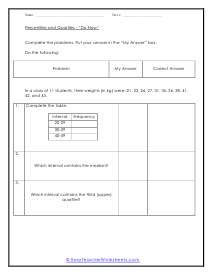
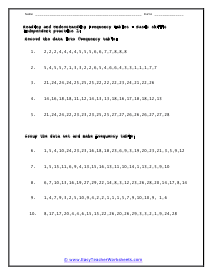
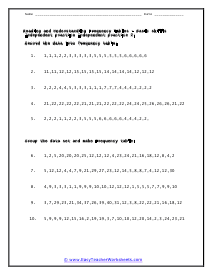
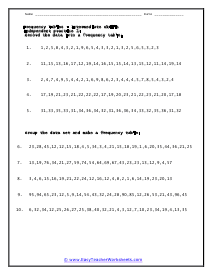
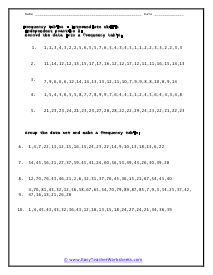
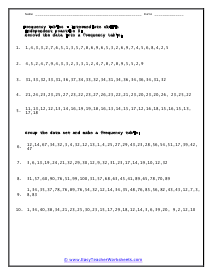
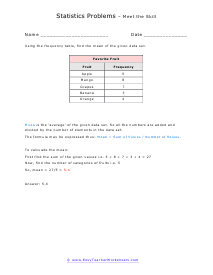
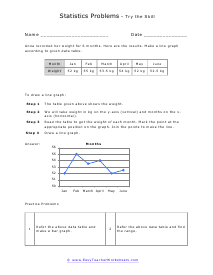
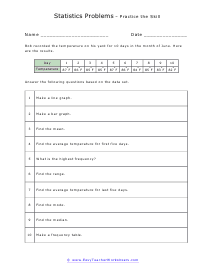
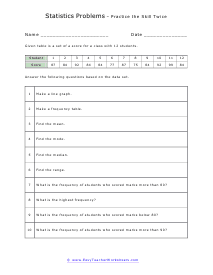
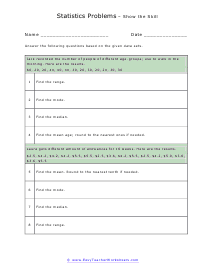
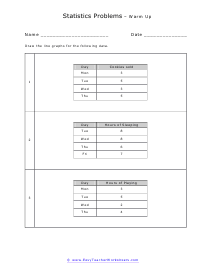
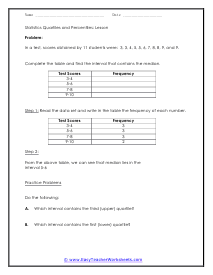
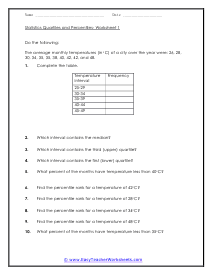
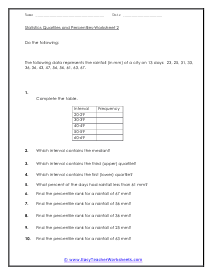
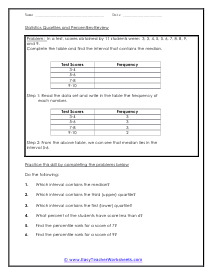
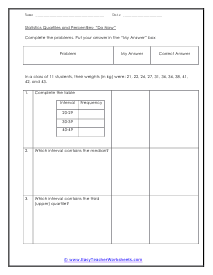
In these worksheets, student will study categorizing data and bias, normal distribution and standard deviation, organizing and interpreting data, percentiles and quartiles, frequency tables, and statistics. They will learn the concepts of qualitative or quantitative data; uni-variate or bi-variate data; and biased or unbiased data and will determine types of data. They will find the percentage of the normally distributed data that lies within a specified standard deviation of the mean. They will organize and interpret data and find the specified percentiles and quartiles. They will also learn to read and understand frequency tables. With some worksheets, extra paper will be required for students to construct frequency tables. For the statistics worksheets, students will draw line graph and bar graphs. This set of worksheets contains step-by-step solutions to sample problems, both simple and more complex problems, a review, and a quiz. It also includes ample worksheets for students to practice independently. Worksheets are provided at both the basic and intermediate skills levels. When finished with this set of worksheets, students will be able to derive statistics from data sets. These worksheets explain how to derive statistics from data sets. Sample problems are solved and practice problems are provided.


