In these worksheets, students will learn to draw a tree diagram to represent outcomes.

A tree diagram is a diagram that has a structure of branching connecting lines, resembling a tree, with each line representing different processes and relationships. Tree diagrams can be useful in expressing probability as they present all possible outcomes in a straightforward and easy to understand, visual way. Probability and statistics are two branches of mathematics that make use of tree diagrams. These are tools in the fields of general mathematics. These are used in probability, and statistics as they help in calculating the number of possible outcomes of an event or problem. The purpose of tree diagrams is to cite those potential outcomes in an organized way. Other names that are used for these tools are decisions trees and probability trees. By using a single point to start, you can reach to exclusive decisions and even experience mutually exclusive events by following a path down the branches of the tree. It comprises of nodes and when each of these nodes are assigned a value, solving tree diagrams become easy.

In these worksheets, your students will learn how to draw a tree diagram to represent outcomes. They will read tree diagrams. They will also draw tree diagrams. Some worksheets contain sample tree diagrams. This set of worksheets contains lessons, step-by-step solutions to sample problems, and both simple and more complex problems. It also includes ample worksheets for students to practice independently. Students may require blank paper in addition to the worksheets in order to draw their tree diagrams. When finished with this set of worksheets, students will be able draw tree diagrams to represent outcomes. These worksheets explain how to draw a tree diagram to represent outcomes. Sample problems are solved and practice problems are provided.


Get Free Worksheets In Your Inbox!


Tree Diagrams Worksheets

Click the buttons to print each worksheet and answer key.

Introduction to Tree Diagrams Lesson

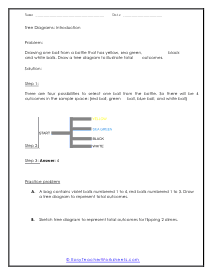
This worksheet explains how to draw a tree diagram to represent outcomes based on this exercise: A shopkeeper has bowl with 2 kinds of filter. Draw a tree diagram to represent the possible outcomes.

Worksheet

See how you make out with this exercise: In the garden Dave saw that there are 2 species available in 3 heights and 2 different quality levels. Draw a tree diagram to represent the possible outcomes.

Practice

You will work on story based problems like: The librarian told to Dave that he can select one of 2 different History books and 2 different Geography books. Draw a tree diagram to represent the possible outcomes.

Review Page 1

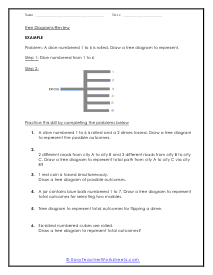
The concept of how to draw a tree diagram to represent a set of outcomes is reviewed. A sample problem is solved.

Review Page 2

You will breakdown six practice story based words problems.

Quiz

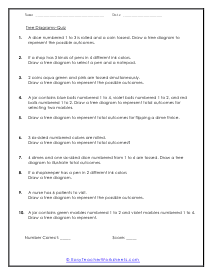
Students will demonstrate their proficiency with the skills and concepts that we have explored here.

Check

You will ponder problems like this: 2 different cold drinks and one of 3 different ice-creams. Draw a tree diagram to illustrate the possible outcomes.

Lesson

We will spell out all the steps that are required to solve this exercise: A family has two children. How many outcomes are in the sample space of 2 generations? A sample problem is solved, and two practice problems are provided.

Tree Diagrams Worksheet

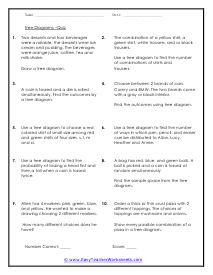
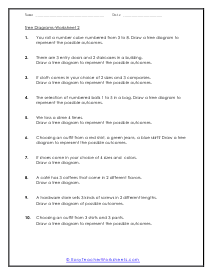
Students will model the foreseeable outcomes of a situation using the techniques we have discussed. Ten problems are provided.

Practice

We will solve exercises like: Pick a table and pick a chair behind the table from carnival game. There are 2 tables and 2 chairs behind them. How many choices are possible? Ten problems are provided.

Tree Diagrams Review and Practice

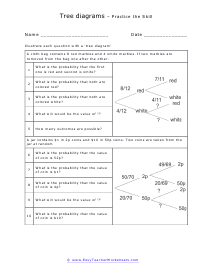
Tackle problems like: A bag contains 3 red and 5 white toys. Pick two toys one after the other. Draw a tree diagram that shows all the possible combinations of toys that Rose can pick?

Quiz

Students will demonstrate their ability with these types of problems. Ten problems are provided.

Check

This is a nice way to either introduce or review the skills that we explore here.

Lesson

This worksheet explains how to model a scenario to represent a set of outcomes. A sample problem is solved, and two practice problems are provided.

Worksheet

You will solve exercises like: A box contains green balls numbered 1 to 4, violet balls numbered 1 to 3, and red balls numbered 1 to 2. Determine a method to represent total outcomes for selecting two marbles.

Working with Tree Diagrams Practice

You will model situations such as: Choosing an outfit from a red shirt, a green jeans, a blue skirt? If shoes come in your choice of 4 sizes and colors.

Review and Practice

This is a cool worksheet where you work on story problems like: 2 different roads from city A to city B and 3 different roads from city B to city C. Draw a tree diagram to represent total path from city A to city C via city B?

Quiz

Students will demonstrate their ability with all concepts we have explored with this topic. Ten problems are provided.
Check

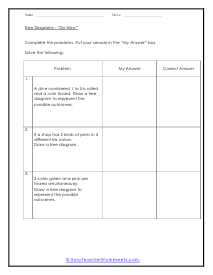
Students will use a well known method to model possible outcomes. Three problems are provided, and space is included for students to copy the correct answer when given.

Using Tree Diagrams Lesson and Practice

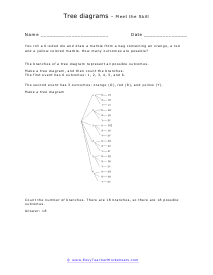
You will put these skills to use for you determining the solution to problems like this: You roll a 6-sided die and draw a marble from a bag containing an orange, a red and a yellow colored marble. How many outcomes are possible?

Practice Worksheet

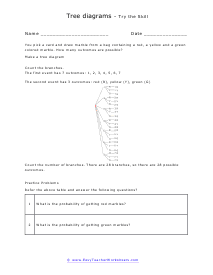
You will model data for situations like this: You pick a card and draw marble from a bag containing a red, a yellow and a green colored marble. How many outcomes are possible?

Worksheet

This is a great visual series of problems for you to extend your skills with this series.

Practice

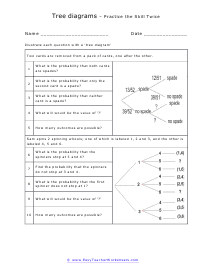
We work with outlier problems that add an extra level of difficulty to everything. Such as: Two cards are removed from a pack of cards, one after the other.

Drill

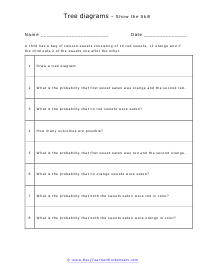
We get a little more advanced with our skills by solving tasks such as: A child has a bag of colored sweets consisting of 14 red sweets, 12 orange and if the child eats 2 of the sweets one after the other. What is the probability that first sweet eaten was orange and the second red?

Warm Up

Check out the type of problems you can find here: Two cards are removed from a pack of cards which are either ace or not ace, one after the other. What is the probability that no aces are obtained?